
Dubuque County Regional Comprehensive Plan


Cover Photos. Clockwise From Upper Left.
- Catfish Creek, Dubuque County. Photo Courtesy of The Catfish Creek Watershed Management Authority.
- Heritage Trail, Dyersville. Photo Courtesy of The Dubuque Chamber of Commerce.
- Dubuque County Courthouse, Dubuque. Photo Courtesy of The Dubuque Chamber of Commerce.
- Swiss Valley Park, Dubuque County. Photo Courtesy of The Swiss Valley Nature Center.
- Main Street, Farley. Photo Courtesy of The City of Farley.
- Rural Dubuque County. Photo Courtesy of The City of Dubuque.
Telephone: (563) 589-7827
WHEREAS, the Dubuque County Regional Smart Plan is consistent with the 10 Iowa Smart Planning Principles contained in Iowa State Code Chapter 18B (collaboration, efficiency, transparency and consistency; clean, renewable and efficient energy; occupational diversity; revitalization; housing diversity; community character; natural resources and agriculture protection; sustainable design; and transportation diversity) which must be considered and may be applied when governments deliberate all appropriate planning, zoning, development, and resources management decisions; and
WHEREAS, the planning process to create the Dubuque County Regional Smart Plan was guided by the Smart Planning Consortium, which included representation from Dubuque County and seven cities, which include Asbury, Cascade, Dubuque, Dyersville, Epworth, Farley and Peosta; and
WHEREAS, the Smart Planning Consortium met throughout the process to review the draft Dubuque County Regional Smart Plan and to provide input on plan language, goals and objectives, and implementation strategies; and
WHEREAS, the Smart Planning Consortium meetings were open to the public, and Public Input Meetings were held as outlined in a Public Participation Plan, to gather input on the Dubuque County Regional Smart Plan.
NOW THEREFORE, BE IT RESOLVED, that the Dubuque County Board of Supervisors approves and adopts the final draft of the Dubuque County Regional Smart Plan for Dubuque County.
PASSED, APPROVED AND ADOPTED this 14th day of January, 2013.
DEC 01 2014
DUBUQUE COUNTY
BOARD OF SUPERVISORS
RESOLUTION - 14-292
WHEREAS, Dubuque County, Iowa was awarded an $89,000 Community Development Block Grant (CDBG) made possible by the American Recovery and Reinvestment Act (ARRA), which was distributed through the Iowa Economic Development Authority (IEDA) for the purpose of creating a Dubuque County Regional Comprehensive Plan; and
WHEREAS, the Dubuque County Regional Comprehensive Plan was adopted by the Board of Supervisors on January 14, 2013 on Resolution 13-029; and
WHEREAS, the Board of Supervisors received a petition from some concerned citizens in Dubuque County after the plan was adopted and decided to allow additional public input through an extended public comment period for the plan; and
WHEREAS, based on additional citizen input collected during the extended comment period, the Dubuque County Regional Planning Consortium has developed proposed amendments to the Dubuque County Regional Comprehensive Plan; and
WHEREAS, the Dubuque County Zoning Board has held a public hearing on the amendments to the plan on October 21, 2014 and the amendments to the plan were recommended to be approved.
NOW THEREFORE, BE IT RESOLVED, that the Dubuque County Board of Supervisors approves and adopts the amendments to the Dubuque County Regional Comprehensive Plan for Dubuque County.
PASSED, ADOPTED AND APPROVED by the Dubuque County Board of Supervisors on this 1st day of December, 2014.
Wayne Demmer
Wayne Demmer, Chairperson – Board of Supervisors
ATTEST:
Mona Manternach
Mona Manternach, Deputy
Dubuque County Auditor
Acknowledgements
The Dubuque County Regional Comprehensive Plan would not have been possible without the feedback, input, and expertise provided by Dubuque County’s Leadership, Citizens, City and County Staff, Federal and State Agencies, and volunteers. We would like to give special thanks to the hundreds of citizens not mentioned below who freely gave their time and creativity in the hopes of building a stronger region.
- Dubuque County
- The City of Asbury
- The City of Cascade
- The City of Dubuque
- The City of Dyersville
- The City of Epworth
- The City of Farley
- The City of Peosta
- The Dubuque Soil and Water Conservation District
- Dubuque County Board of Supervisors
- Asbury City Council
- Cascade City Council
- Dubuque City Council
- Dyersville City Council
- Epworth City Council
- Farley City Council
- Peosta City Council
- Dubuque Soil and Water Conservation District Board
- City of Dubuque Long Range Planning Advisory Commission
- Dubuque County Zoning Board
- City of Asbury Planning And Zoning Commission
- City of Cascade Planning and Zoning Commission
- City of Dyersville Planning and Zoning Commission
- City of Epworth Planning and Zoning Commission
- City of Farley Planning and Zoning Commission
- Janet Berger, City of Epworth
- Beth Bonz, City of Asbury
- Laura Carstens, City of Dubuque
- Bill Einwalter, City of Farley
- Joyce Jarding, City of Farley
- Dave Johnson, City of Dubuque
- Randy Lansing, City of Cascade
- Tim Long, City of Cascade
- Mick Michel, City of Dyersville
- Anna O’Shea, Dubuque County
- Eric Schmechel, Dubuque SWCD
- Karen Snyder, City of Peosta
- City of Dubuque Leadership Team
- Dubuque Economic Development Department
- Dubuque Housing and Community Development Department
- Dubuque Metropolitan Area Transportation Study
- Dubuque Planning Services Department
- Dyersville Economic Development Corporation
- Eastern Iowa Regional Housing Authority
- Greater Dubuque Development Cooperation
- Regional Planning Affiliation 8
- Paige Comer
- Dan Fox
- Jacob Ironside
- Gail Kuhle
- Chandra Ravada

Contents
- Introduction 7
- Public Participation 9
- Issues and Opportunities 12
- Community Character 18
- Community Facilities 42
- Public Infrastructure and Utilities 60
- Transportation 71
- Economic Development 96
- Housing 112
- Agriculture and Natural Resources 123
- Hazard Mitigation 137
- Watershed Management 154
- Land Use 170
- Intergovernmental Collaboration 190
- Implementation 198
Introduction
The Dubuque County Regional Comprehensive Plan is the result of a planning process that began in late 2010 and which is regional in nature in that it included participation by the County; the Soil and Water Conservation District and 7 cities including the cities of Asbury, Cascade, Dubuque, Dyersville, Epworth, Farley and Peosta. This plan seeks to build on the strengths of what we know to be a safe, livable, and friendly community.
The Dubuque County Regional Comprehensive Plan was created using information from the city’s and county’s comprehensive plans, the Soil and Water Conservation District, current census data, and local input and will serve as Dubuque County’s Comprehensive Plan. The comprehensive plan has two primary purposes. The first provides an essential legal basis for land use regulation, such as zoning and subdivision control. Secondly, the comprehensive plan presents a unified vision for a community derived from the input of its citizens and establishes the specific actions necessary to fulfill that vision.
The intent of a comprehensive plan is to cast a wide net and touch on all topics relevant to the future development of the community. On its own, a comprehensive plan has no legal authority; it is merely an agreed upon road map for the future development of the community. Because it deals with issues that may be as many as thirty years down the road, the plan cannot chart a highly specific course. Instead it points the way towards goals and objectives and acts as a reminder of the general policies that the community should consider when making development decisions.
To achieve the goals and objectives listed in its comprehensive plan, a community must actively work to incorporate the recommendations of the comprehensive plan into its budgets, policies, and ordinances. Many of the goals and objectives listed in the Plan will require additional research and analysis, public input, and consideration from the County before they can be implemented. When choosing how to implement the goals and objectives of this plan, the Dubuque County Board of Supervisors should consider all relevant factors and weigh the public good with the cost and impact to private property owners. Examples of factors to be considered include:
- The costs and benefits of the project. A project may increase the tax base, create jobs, create new recreational opportunities, improve environmental quality, or create other benefits to the public, but it may also create costs such as extension of roads, increase in traffic, incur maintenance or other reoccurring fees, etc. The County should diligently analyze each project, weigh its benefits against its cost, and select the most cost-efficient and effective method for implementing the project.
- Impacts on private property rights. In implementing this plan, the County should seek to strike a balance among many competing demands by creating development patterns that are orderly and rational, and provide the greatest benefits for individuals and the community as a whole, while balancing private property rights.
- The costs to provide roads, sewer, water etc. to new development. The location, size, and scale of new development affects the cost of providing services to that development. Prior to approving a new development project, the County should consider the cost to provide services to the new development. Typically, rural subdivisions take up at least twice as much land and cost about 40 percent more to provide with public services than do subdivisions within or adjoining
existing communities. This type of development can lead to the loss of productive farmland and to conflicts with neighboring farmers over dust, odors, and other aspects of modern farming. (Taken from Feb 2001 ISU Land Use Series on The Comprehensive Plan.)
- The burden on existing public services. Most public services including roads, police and fire protection, water and sewer facilities, and schools have a limited capacity. When implementing a project, the County should determine if enough excess service capacity exists to meet the needs of any new development and that development is not a burden on the community as a whole.
- Compliance with state and federal law. When implementing any projects related to this plan, the County should be aware of any state or federal laws relating to the project to make sure the public is protected and development occurs in a safe and environmentally friendly way.
Once adopted, the comprehensive plan is not an infallible or unchangeable document. One large development could require changes to the plan. This plan should be updated every 5 to 10 years or when necessary so that it continues to provide an accurate picture of how the community wishes to grow, develop and prosper.
Participation
Chapter 1
One of the primary objectives of the Comprehensive Plan is to develop goals, objectives, and policies that reflect attitudes and opinions of the region. To achieve this objective, the Consortium worked to develop a transparent and inclusive public participation process that could provide diverse interests with the opportunity to develop a shared vision. Public participation was at the heart of the Comprehensive Plan, and the Consortium incorporated public feedback into every step of the planning process. This chapter will outline the public participation process used in the Comprehensive Plan, and will summarize some of the input collected through this process.
Public Participation Process
The Consortium developed a Public Participation Plan (PPP) that outlined the group’s strategy for engaging the public and collecting their input. The PPP was adopted in April of 2011 and was amended in July 2012. The PPP placed much of the responsibility for community engagement on the Smart Planning Consortium Representatives. Each community participating in the Comprehensive Planning process had one representative who was a familiar community figure such as a city staff member or elected official. The representatives helped build public awareness of the project in their community by reporting Consortium activities to their council or board. Representatives also collected feedback from their communities and reported back to the Consortium. Consortium representatives worked with ECIA staff to organize and facilitate public workshops. The community awareness created by the representatives’ reports resulted in effective public participation at the community workshops.
Public Meetings and Forums
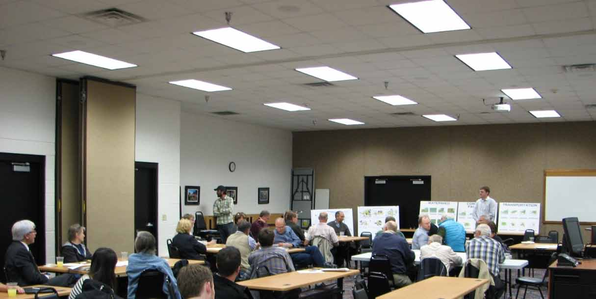
The Consortium held meetings throughout the Comprehensive Planning Process. The goal of these meetings was to provide opportunities for open discussion of the issues at hand. All Comprehensive Planning meetings were open to the public and attendance was made part of the record. Consortium meetings were held twice each month for eighteen months to work on the fourteen planning elements. Meeting locations rotated between the consortium members. This gave residents of each community the opportunity to attend a meeting in their own city, and allowed consortium members to visit and learn more about the other communities within the region.
In addition to regular Consortium meetings, the PPP called for a series of public input meetings, which included:
A Comprehensive Plan “Kickoff Meeting” was held in February 2011. The purpose of this meeting was to provide background on the Iowa Smart Planning Law and Comprehensive Planning Process, and to get an idea of what public officials and community leaders were expecting from the plan.
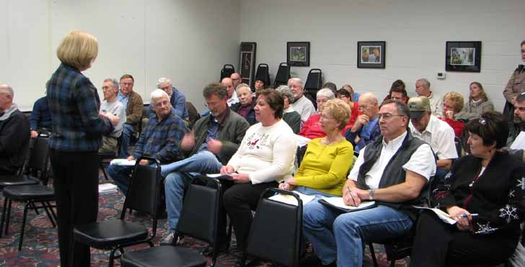
Three rounds of local public input meetings were held in each city and in Dubuque County in November and December 2011, and in August and September 2012. The purpose of these meetings was to present the results of inventories and analyses conducted in support of the Comprehensive Planning Process, and to obtain public input on draft chapters of the plan and related issues in each community.
A Final Public Input meeting was held in October 2012. The purpose of this meeting was to review the final draft of the Comprehensive Plan and to solicit input on future implementation for the goals and objectives of the plan.
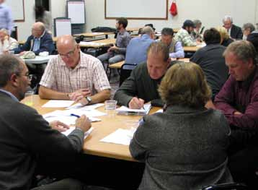
The Consortium used several different public engagement methods in the public input meetings to generate discussion. In the kickoff meeting and the final input meeting, the Consortium used small breakout groups. In these meetings, participants were divided into several small groups to discuss a variety of topics. At the end of the discussion period, the small groups reported their ideas back to the larger groups. In the local meetings, the Consortium used a sticky note activity to guide the discussion. In this activity, participants wrote down one thing they liked about their community and three things that they would like to see changed in the future on sticky notes. Participants shared their responses with the group and the sticky notes were collected, organized into groups, and recorded. The responses from the sticky note activity were used to develop a priority ranking survey that was distributed at a later meeting. The Consortium used the public input survey to determine the top priorities for each community.
Engagement Efforts
In addition to meetings, the Consortium employed several public engagement efforts throughout the planning process. These ongoing public participation efforts provided Dubuque County citizens with general education on the Comprehensive Planning Process, information about upcoming participation sessions, and updates on plan progress. Ongoing public engagement efforts include the following:
The Consortium created a project website that included updates regarding plan progress, upcoming public participation sessions, Consortium meeting agendas and minutes, PowerPoint presentations from public meetings, and public notices. The site also included a web-based feedback form, where visitors could post comments related to the planning process. Public access to the internet was available at public libraries throughout the county for residents without other internet access. The website address is www.dubuquesmartplan.org.
News releases and feature articles regarding the planning process and updates on the plan were provided to local newspapers, radio and television stations, and local governments, and were posted on the project website. Several media outlets published stories on the Comprehensive Plan during the process.
The Consortium actively solicited comments and suggestions at appropriate stages in the development of the Comprehensive Plan from county residents, local business and civic organizations. Some of the organizations that provided input were conservancy and environmental organizations, state and federal agencies, school districts, utility companies, utility districts, community development authorities, boards and commissions, and local governments.
Outcomes of the Public Participation Process
The Consortium learned a great deal about the communities within Dubuque County through discussions with community members and public meetings. Many of these concerns and issues will be covered in depth in the chapters of the Comprehensive Plan, but a couple of recurring themes will be highlighted here because they set the tone for the planning process.
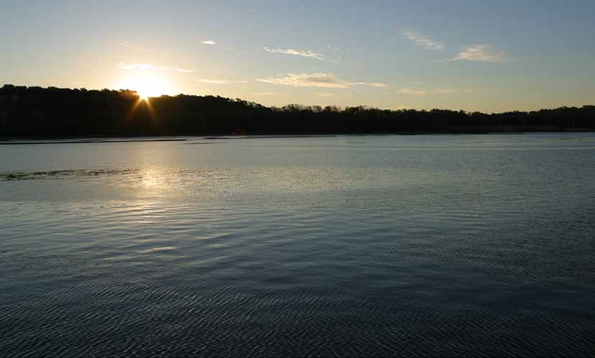
Rural Character – Dubuque County’s communities are very proud of the rural character of the region. Throughout the planning process, Consortium members heard that natural beauty, productive agricultural lands, and small town atmosphere are very important to the people living in the region. Many would like to see development happen in a balanced way that allows for new growth while protecting the rural character of the region.
Individual Character – The region is made up of a collection of distinctive communities. Maintaining each community’s individual character is an important goal for many in the region. Some residents expressed that they did not want their community to look like everywhere else. Many residents said that they would like to see the Consortium members work together as a region, by building on each community’s unique characteristics.
Volunteerism – Many community leaders told the Consortium that they could not do what they do without help from volunteer groups. The consensus was that communities should continue to engage and work with volunteer groups on future projects.
Recreation – Dubuque County residents feel that recreational opportunities are very important for the future of the region. Residents listed several types of recreational facilities needed or wanted including parks, trails, swimming pools, and community centers. Most residents said they would like to see their community expand on existing recreational opportunities, and they would like to see the consortium members work together on regional recreational projects such as the Heritage Trail.
Public Participation
Jobs – Finding good quality employment is a primary concern for all Dubuque County residents. Residents want to see their community expand employment opportunities by working to grow existing businesses and add new businesses in the region.
Retail – Many residents desire to shop in their own community. Many residents mentioned the need for a diverse selection of retail opportunities such as a local grocery store or clothing store. Many of the retail comments were focused around downtowns. In communities that have downtowns, the residents want to see improvements such as filling empty storefronts. In communities that do not have a downtown, residents saw the positive impacts from downtowns in other communities and wanted to develop plans to create a downtown in their community.
Transportation – Residents want their community leaders to work to maintain the quality of the region’s roads and bridges and to continue to expand opportunities for walking, biking, and public transit. Traffic congestion and roadway safety were important issues for residents.
Issues and Opportunities
Chapter 2
The Consortium held a series of 24 public input meetings to collect public input for the Dubuque County Comprehensive Plan. The Consortium hosted an initial planning kickoff meeting in February 2011. Individual communities held workshops in November 2011, December 2011, August 2012, and September 2012. The Consortium held a final wrap up meeting in October 2012. At the workshops, community members were asked to describe things they liked about their community and things they would like to see changed in the future. The Consortium used the information collected through the public input process to create a list of strengths, issues, and opportunities for the community. The Consortium then refined the list of issues and opportunities down into one unified vision for the region and created goals and objectives for each chapter based on that vision.
Vision
Dubuque County comprises a diverse group of communities, each defined by a unique heritage. The goal of the Dubuque County Comprehensive Plan is to improve the quality of life for all the region’s residents by working together to identify each community’s strengths, and employing those strengths to create a long-term plan for a more sustainable region.
The communities of Dubuque County have united to form a consortium to create and maintain a regional plan for sustainable development. The Dubuque County Comprehensive Plan will guide future sustainable development in the region by incorporating the Comprehensive Planning elements and principles that are listed in Figure 2.1.
Goals and Objectives
Each chapter of the Comprehensive Plan is based on one of the Smart Planning Elements. Each chapter provides a discussion of the element followed by a list of goals and objectives that apply to the element. The Smart Planning Consortium has produced a list of goals and objectives for each of the Comprehensive Plan chapters based on input from the member communities and the public participation process. In the final chapter, Implementation, the Consortium provides a list of policies and projects that, once implemented, will help the communities of Dubuque County achieve the goals and objectives set forth in this regional plan for sustainable development.
Issues and Opportunities
Figure 2.1 - Smart Planning Elements and Principles
| Elements | Principles |
|---|---|
| Public Participation | Collaboration |
| Issues and Opportunities | Efficiency, Transparency, and Consistency |
| Land Use | Clean, Renewable, and Efficient Energy |
| Housing | Occupational Diversity |
| Public Infrastructure and Utilities | Revitalization |
| Transportation | Housing Diversity |
| Economic Development | Community Character |
| Agricultural and Natural Resources | Natural Resources and Agricultural Protection |
| Community Facilities | Sustainable Design |
| Community Character | Transportation Diversity |
| Hazards | |
| Intergovernmental Collaboration | |
| Implementation | |
| Watershed Planning |
Community Character
Strengths - Many residents who spoke at the public meetings listed the small town atmosphere and the closeness of the people in the community as one of the things they liked about their town. This was true even in the City of Dubuque where residents enjoy the small town atmosphere despite living in a city with a population of almost 60,000. Residents described their fellow community members as friendly, caring, willing to lend a hand, and committed volunteers. Residents participating in the planning process placed a high value on downtown areas, historic buildings, and the County's agricultural roots.
Issues - Some communities see new development as a threat to the character of their community. Development on agricultural land, forestland, and the Mississippi River bluff lands can alter the landscapes that are enjoyed by many. Some communities saw their downtown as a strength while others felt their downtown could use some improvement. In general, many residents wanted to see an increase in activity in the downtown area with more businesses, more people out on the street, and more activities.
Opportunities - Communities feel that preserving and enhancing the character of their community should be a top priority in the future. New development in the community should respect and preserve the existing community character. Many residents would like to see policies focused on enhancing downtown for local shopping, dining, and recreation. Many communities would also like to see policies that preserve the natural and rural agricultural character of the region.
Community Facilities
Strengths – Communities in Dubuque County have a long history of collaborating to provide high quality community facilities to their residents. Local governments within the region have mutual aid agreements for fire and police services and both public school districts serve multiple communities. Coordination between the public and private sector facility providers is also commonplace. Private entities in Dubuque County provide education, emergency medical services, hospital services, and childcare facilities.
Issues – Dubuque County school districts, law enforcement and fire protection agencies, and parks managers provide high quality opportunities and services to their communities. As the region's population grows, maintaining adequate capacity will challenge providers of local facilities. The communities of Dubuque County should promote quality community facilities by coordinating development decisions and providing adequate facility capacity.
Opportunities – Smart Planning Consortium members have the opportunity to provide high quality community facilities by maintaining the existing intergovernmental and public-private facilities relationships, and looking for areas to establish new relationships.
Public Infrastructure and Utilities
Strengths – Dubuque County communities have worked together with public and private partners to provide excellent water distribution, wastewater collection and treatment, solid waste and recycling, telecommunications, and electrical services to serve their expanding populations. Many of those who participated in the community workshops for the Comprehensive Plan stated that they were satisfied with their utility services.
their expanding populations. Many of those who participated in the community workshops for the Comprehensive Plan stated that they were satisfied with their utility services.
Issues – Growth over the past several years has caused some growing pains for the County's infrastructure and utility providers. Between 1990 and 2010, Dubuque's population began to decentralize, relocating from the City of Dubuque to the smaller cities and the unincorporated rural areas of the county. The pace of the decentralization has accelerated within the last ten years, and the new development tends to be lower density than development from previous years. The spatial population shift of the past 20 years has resulted in expansion of public and private infrastructure within previously undeveloped areas of the County and has left behind underutilized infrastructure in some historically developed areas. The low-density nature of new development has increased the cost of providing service to these newly developed areas.
Opportunities – Effective land use and utility planning are especially important during uncertain economic times. During hard economic times, communities need to “do more with less.” In other words, the community needs to get more out of the investments it makes, or improve its return on investment. Communities invest in many things, but utility infrastructure is one of the largest and most important investments a community will make. Communities invest in the installation and maintenance of infrastructure to stimulate private sector investment and development, which creates value in the local economy. The value created is taxed and the tax revenue is used in part to pay for the maintenance of the infrastructure. Dubuque County communities can implement infrastructure and land use policies such as controlling urban sprawl and encouraging growth in or near cities to help them provide services efficiently, create economic value, and maximize the return on the community’s investment.
Transportation
Strengths – Most city residents were happy with the conditions of their local streets. Several stated that they felt their local governments do a good job of performing routine street maintenance and keeping streets passable during the winter months. In the smaller towns, residents listed the ability to live in a small town and commute to Dubuque for work, shopping, and recreation as a primary benefit of living in their town. Meeting participants also listed the region’s bicycle and pedestrian trails as a major asset for the region.
Issues – Transportation is a very important issue for many Dubuque County residents. Changing development patterns in the County have resulted in increased vehicle traffic on the region’s roads, as many local residents live in one community and commute to another for work. Increasing traffic is projected to result in congestion and safety issues in the coming years. Safety issues were at the top of the list for future transportation projects. Safety on US 20 was a major concern. At-grade intersections along US 20 have seen several accidents and fatalities over the past several years. The condition of rural roads and bridges was also a major concern for county residents. New development in rural areas has increased traffic on roads and bridges that were designed for low traffic rural use. Changing demographics also present a transportation issue for the residents of Dubuque County. With an aging population, those who are unable to drive are expected to make up a larger percentage of the population in the future. The underlying challenge with all of these issues is funding. Dubuque County communities will need to find ways to make necessary improvements using available funding.
Opportunities – Dubuque County communities see an opportunity to improve the transportation network to provide connectivity to more areas of the county, provide mobility to more county residents, and encourage more economic development opportunities. Residents would like a multi-modal transportation system where they are able to walk, ride their bike, or take public transit from their home to their destination without using a car. Communities along the Heritage Trail would like to expand on the trail’s recreation and economic impact within the region. Communities can implement policies that maximize the return on transportation funds. Mixed use development and complete streets are two of the tools that communities can use to help get the most out of their limited transportation funds.
Economic Development
Strengths – Manufacturing is a strong industry in Dubuque County, employing 16% of the workforce. The region is home to several large manufacturers including John Deere. These companies employ thousands of workers and are an important part of the regional economy. Business services is also a strong employment sector in the region. The business and professional services sector provides needed services such as consulting, processing, legal, management support, etc. to all of the other industries in the region. Tourism has remained strong in the region and will continue to be a priority with the National Mississippi River Museum and Aquarium, the Grand River Center, the Field of Dreams, the National Farm Toy Museum, Sundown Mountain, and Heritage Trail.
Dubuque County, employing 16% of the workforce. The region is home to several large manufacturers including John Deere. These companies employ thousands of workers and are an important part of the regional economy. Business services is also a strong employment sector in the region. The business and professional services sector provides needed services such as consulting, processing, legal, management support, etc. to all of the other industries in the region. Tourism has remained strong in the region and will continue to be a priority with the National Mississippi River Museum and Aquarium, the Grand River Center, the Field of Dreams, the National Farm Toy Museum, Sundown Mountain, and Heritage Trail.
Issues - Many residents see a shortage of high quality jobs in their communities. While the region's manufacturing base is strong, it has declined significantly over the last 50 years. The Dubuque County regional economy faces a future shortage of skilled workers because of retirements. As the baby boomer generation begins to retire, employers in Dubuque County will be forced to replace and train thousands of skilled workers. Finding new employees with the required education and training will be a top priority for the region’s employers. Natural disasters have also been a major issue for the region’s businesses. Flooding in 2008, 2010, and 2011, and a severe drought in 2012 have negatively impacted businesses in the region.
Opportunities – Dubuque County communities have the opportunity to implement programs and policies to attract a diverse set of new employers to the community. Local governments can invest in infrastructure, promote workforce education, and strengthen business development programs to stimulate expansion in all industrial sectors. The Dubuque County region has the opportunity to expand on a well-established tourism industry. The communities of Dubuque County can work together to promote regional tourism which could bring more people and dollars into the area.
Housing
Strengths – Housing is an important asset for Dubuque County residents and local governments. The Dubuque County housing market, like many in the Midwest, has remained relatively stable during the recession. Dubuque County was largely left out of the housing price boom of the 2000's, but it also did not experience a crash when prices adjusted during the recession. The area is also an affordable place to buy a home. The majority of homeowners in Dubuque County pay less than 30% of their income towards housing. The region has established programs to assist those who do not have affordable housing. The City of Dubuque Housing and Community Development Department and the Eastern Iowa Regional Housing Authority manage public housing, rental assistance, and other housing programs within the region.
Issues and Opportunities
Issues – Owner-occupied housing in Dubuque County is relatively affordable when compared to the rest of the United States, but housing affordability is an issue for those who rent in the county. 48% of renters pay more than 30% of their income towards housing. Combined transportation and housing costs are also an issue in Dubuque County. Some people consider living in rural areas because of lower home prices, but in these areas the distance between home, work, school, and other daily needs is greater. Using a combined transportation and housing cost measure, 29% of county households meet the affordability threshold, compared with 75% using the housing only measure.
Opportunities – Dubuque County communities can work together to address housing issues in their community. Working together with the private sector, nonprofit, and other government agencies, communities in Dubuque County can ensure a diverse and affordable housing supply throughout the region. Communities can update policies to allow for more affordable housing and reduce transportation costs. Communities can also introduce programs that encourage improved relationships between tenants and landlords.
Agriculture and Natural Resources
Strengths – Dubuque’s location in the Driftless Area of the Mississippi River Basin provides a beautiful region of diverse topography, soils, and ecosystems. Rugged terrain limits agriculture in the eastern half of the county; however, the western half of the county has flatter land and high quality agricultural soils. Through the public input process, many participants listed the natural beauty of the region as a primary reason for living in Dubuque County.
Issues – Dubuque County is home to a variety of natural features that make it unique in the State of Iowa. New development can put increased pressure on these valuable natural resources. In recent years, air quality has become a concern for Dubuque County communities. The region currently meets the Federal clean air criteria, but the region’s air quality is approaching non-attainment levels. Water quality has also been a concern in Dubuque County. Extensive monitoring in the Catfish Creek Watershed has shown elevated levels of bacteria, nitrates, and chloride. If the current trends in air and water quality are not reversed, both could pose a serious threat to quality of life in the future.
Opportunities – The residents of the region have the opportunity to establish the policies that will ensure that future generations will be able to enjoy the County’s valuable natural features. Communities should encourage the creation of a sustainable environment that balances agricultural and urban growth and development, with ecological constraints.
Hazard Mitigation
Strengths – In recent years Dubuque County has been impacted by several natural disasters. The region has used the lessons learned from our recent experiences to improve hazard mitigation and preparedness activities. Communities in the county have worked together to rebuild, recover, and plan for the future. The County has adopted a multijurisdictional hazard mitigation plan that will guide future hazard mitigation activities in the coming years.
Issues – Over the past several years Dubuque County has sustained heavy damage from natural disasters. Flooding in 2008, 2010, and 2011 and a severe drought in 2012 disrupted everyday life and caused millions of dollars in damage to businesses, agricultural operations, and local infrastructure.
Opportunities – Communities in Dubuque County need to make use of the time between natural disasters to plan and make their communities more resilient to hazards. Implementing building codes to prevent property damage from winter storms and severe storms, stormwater management practices to limit flooding, and improving buildings and infrastructure are examples of things communities can do to improve resiliency to hazards.
Watershed Planning
Strengths – Dubuque County recently adopted erosion control and stormwater ordinances that aim to reduce flooding and protect water quality. The erosion ordinance requires developers to obtain a permit and install erosion control practices on a job site during construction. The stormwater ordinance requires developers to install stormwater mitigation practices that will reduce the amount of runoff from the completed development. The idea behind the ordinance is to help reduce the impact of new development on flooding and water quality. Developers may choose from a variety of options to control stormwater. In addition to Dubuque County, several cities in the region have adopted or are considering similar ordinances.
Issues – Flooding has been a major issue for Dubuque County. Major flood events in 2008, 2010, and 2011 disrupted everyday life and caused millions of dollars in damage to businesses, agricultural operations, and local infrastructure. Many community leaders and residents sought improvements to stormwater mitigation, water quality, and flood control.
Opportunities – Understanding the importance of land use planning, the impacts of infiltration based practices, and developing site specific boundaries of non-point source pollution within a watershed will lead to improvements in our local watersheds. Communities can help improve local watersheds by implementing policies that identify and avoid sensitive areas, minimize impervious surfaces, and implement stormwater best management practices. Communities need to work together to repair the damage done to in-stream habitat and reduce the rate and volume of stormwater flow using infiltration based practices.
Land Use
Strengths – The period following the 1980s recession was one of recovery and growth for the Dubuque County economy. Between 1990 and 2007, the County saw a growing population, diversification of industry, and increasing employment. Beginning in 2007, the global economic recession slowed growth, but the local economy has remained relatively stable through the recession. Economic growth and investments in transportation infrastructure during this period lead to the physical expansion of the County’s communities.
communities.
Issues – The pattern in which new development has occurred has led to some issues for Dubuque County communities. For example, new commercial development has, in some cases, come at the expense of established downtowns. Rural residential development has consumed valuable natural and agricultural land, increased traffic on rural roads, and led to an increased number of septic systems which come with the potential for contaminated water.
Opportunities – Urban sprawl has been an issue that has been around since the first Dubuque County Land Use Plan in 1969. The communities of Dubuque County will need to develop policies and ordinances to address these important land use issues while encouraging needed economic development. Communities can use tools such as form-based codes, mixed use development, and conservation subdivisions to provide adequate land for new development while controlling sprawl, protecting the natural environment, and preserving the character of the region.
Intergovernmental Coordination
Strengths – Historically, the communities in Dubuque County have a good working relationship. Dubuque County communities are able to cooperate to complete projects of mutual interest. Communities also work together to share information, resources, and are active in several regional organizations. The communities of Dubuque County have demonstrated a strong commitment to intergovernmental coordination by participating in the Smart Planning Consortium.
Issues – Dubuque County communities work together to provide the best services possible to their citizens; however, conflicts between communities have arisen in the past. Conflicts over land development and annexations have occurred between cities and Dubuque County in various ways and intensities. While these conflicts do not occur very often, it is important for communities to work together to find an agreeable solution for all sides.
Opportunities – Coordination between local governments is an important issue that was identified through the planning process. Community leaders have found that they can achieve their goals by cooperating instead of competing with their neighbors. Economic development, agricultural and natural resource protection, and hazard mitigation are some of the areas where communities can work together to achieve common goals.
Character
Chapter 3
Dubuque County is composed of a collection of communities that each have their own unique history and character. Community character is subjective. There is no exact formula for community character. Some of the components that make up community character include community culture and heritage, small town atmosphere, historic buildings, natural features, and the people who live in the community. Community character is determined by the characteristics, landmarks, and intangible elements that people identify with a specific community and that make the community a great place to live. Community character is often the reason why people choose to live where they do.
During the Comprehensive Planning Process, the Consortium asked local residents to write down the things that they liked most about their community. Many of the comments focused on community specific topics, but there were a few common elements that came up in all communities.
Small Town Feel – Despite the wide range in community sizes, “small town feel” was cited as a positive characteristic in every consortium member community.
Agriculture – Many residents in all Dubuque County communities feel a close connection to agriculture.
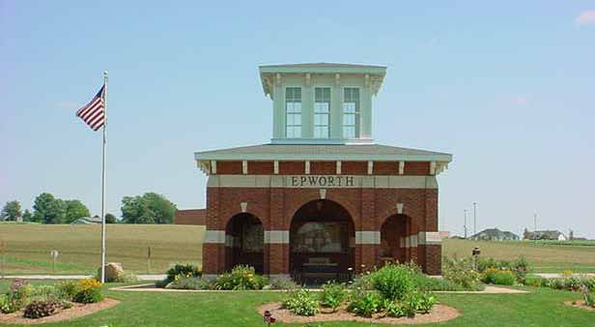
Photo Courtesy of The City of Epworth
Agriculture is a very important part of the regional economy, and many rural and urban residents are employed directly or indirectly in the industry.
Historic Architecture – Dubuque County was one of the first areas settled in Iowa, and as a result is home to many historic buildings. Historic downtowns, homes, and churches can be found across the county.
Natural Environment – Dubuque County’s unique geography and location on the Mississippi River provides a wonderful natural setting. The county has an abundance of natural landscapes, scenic vistas, and diverse wildlife.
Dubuque County communities have many things in common, but they also have distinct differences that make each community unique. It is important for communities to identify, protect, and expand on those unique things that make their community a great place. The Consortium members have provided a description of the unique aspects of their community.
Dubuque County
The area that is now the State of Iowa was included as part of the Michigan Territory in 1834. When a portion of the Michigan Territory was admitted to the Union as a state in 1836 the rest was set aside as the Wisconsin Territory, which included all of what is
known as the State of Iowa. Iowa was originally two counties, Demoine County and Dubuque County. In 1837, during the second session of the Wisconsin Territorial Legislature, Dubuque County was subdivided into 14 other counties: Benton, Buchanan, Cedar, Clayton, Clinton, Delaware, Fayette, Jackson, Johnson, Jones, Keokuk, Linn, Scott and Dubuque. Dubuque County contains land area of 612 square miles which includes the City of Dubuque as the largest of 21 cities in the County and which serves as the county seat.
The first official meeting of the Dubuque County Board of Supervisors was held on May 13, 1836. The first courthouse building was made of logs and was completed October 1, 1836. It was intended to be used as a courthouse; however, it was never used for that purpose but as a jail instead. The present courthouse was completed in 1893 and is still used as the main county office building today.
In 1838, Dubuque County had 2,381 inhabitants; by 1856 that had risen to 26,871. Dubuque County has experienced some hard economic times in which the population dropped from 93,745 in 1980 to 86,403 in 1990, a drop of 7.8%. The steep decline was due in part to the sale and ultimate closure of the Dubuque Packing Co. and the farm crisis which caused the reduced demand for equipment at John Deere Dubuque Works. However, with the expansion of tourism and gaming, and a more diversified industrial and business sector, we have seen growth in employment and population over the last 20 years. Dubuque County has recovered and now has a population close to that of the 1980’s of 93,653.
Dubuque County Comprehensive Plan and Vision Statement
Dubuque County’s Comprehensive Plan was adopted on September 23, 2002 along with a Future Land Use Development Map. This Plan is currently being amended and updated through the Dubuque County Smart Planning Consortium to meet the needs of our growing communities. The regional plan for the County will focus on preservation of farm land and rural character, managing growth around and adjacent to the cities and building a more sustainable region by incorporating the smart growth principles into our Comprehensive Plan and development codes.
Community Character
Dubuque County has a vision of what it aspires to be, which improves the success of long-range planning. This brief statement summarizes the County's collective vision of an ideal future, a future that relies on cooperative efforts to retain valued assets and enhance the quality of life for all residents.
Dubuque County residents will work together to maintain a sound, safe environment with a prosperous farm sector and thriving communities which contribute to a diverse economic base where families and young adults will retain and earn a living wage while enjoying modern educational facilities, and a variety of cultural and recreational opportunities. Dubuque County will enjoy moderate, planned growth that preserves the rural life style and scenic character of the area while supporting renovation of older urban areas, affordable housing, and improved transportation systems.
Dubuque County is managed by three elected representatives to the Board of Supervisors. The County has a budget of $62,000,000 for 2012 and more than 368 full time employees. The County provides valuable services to all the residents of Dubuque County from the following departments: City & County Assessor, County Auditor, County Conservation, County Attorney, County Library, Mental Health & Developmental Disabilities, Emergency Management & General Relief, County Health, Personnel, County Recorder, Secondary Roads, Sheriff, Sunnycrest Manor, County Supervisors, County Treasurer, Veteran’s Affairs, and County Zoning Department.
Asbury
The City of Asbury once was called the “tiniest town in the state” with a population of 27 people. Asbury was incorporated on September 7, 1933 after the repeal of prohibition, in order to have legalized beer sales. The initial settling of the community was principally by Methodists who named the community after Bishop Francis Asbury, the first Methodist Bishop in America. The town’s earliest roots are remembered as a village when farmers would travel to have their horses shod, and visit the general store and local tavern. There were two churches, the Asbury Methodist Church and St. Philamena’s Catholic Church, and a one room schoolhouse. The incorporated city limits consisted of approximately eleven acres.
The community now has grown to a population of 4,357, covers three square miles, and is the second largest city in Dubuque County. The City remains true to its humble beginnings as a residential community. Asbury has the feel of being close to everything—school, work, recreation, and church. In the last fifteen years, the City has added ten residential developments, two commercial developments (Asbury Mall and Saratoga Plaza), expanded the park and recreational opportunities for residents (new park property, resurfacing of multipurpose courts, county library site, and purchase of Meadows Golf Club), and improved the utility services provided to residents (water tower, upgrades to wells and upgrade to wastewater treatment plant). Asbury Road continues to be the backbone for transportation through the community. Other major roads to service the community include Seippel Road, Radford Road, and Hales Mill Road.
The City has set its direction to maintain a high quality community where people live, learn, grow, work and play—the kind of place that people want to call home.
Cascade
The City of Cascade is located on the border of Dubuque and Jones Counties. Cascade was named for its location near a waterfall on the North Fork of the Maquoketa River, which runs through the City. US 151 runs along the northern part of the City, and Iowa Highway 136 runs north and south through the City. Cascade is approximately 25 miles from the City of Dubuque and 45 miles from the City of Cedar Rapids. The current slogan for the City is “the place we call home,” which fits well with this quaint all-American town that has so much to offer with beautiful historic buildings, wonderful places to eat and many unique antique and gift shops.
The two most significant economic realities in the community's past are its location on a river with a falls, and on the Old Military Road. The river was the site of the town’s first industry—a mill. The Military Road was a major artery bringing settlers into the State of Iowa. With the advent of the automobile, the road became US 151, increasing residents’ mobility and allowing farmers to come to Cascade to purchase goods.
The North Fork of the Maquoketa River and hilly topography with wonderful vistas are superb natural assets for the City of Cascade. Residents capitalize on the natural beauty by maintaining their homes, yards, and gardens with obvious pride.
Dyersville
The spring of 1846 saw a company of forty-two souls in ten families who had left their native Bavaria in 1845 make their way up the Mississippi River by boat from St. Louis, and land at Dubuque, Iowa. After transferring their belongings to covered wagons drawn by oxen, the ten families moved westward. Their good farming sense prompted them to call the gentle valley they found a few miles south of the settlement of New Vienna their new home.
In 1847, at the age of twenty-six, James Dyer arrived in the area. His family and friends followed from Somersetshire, England. Dyer was a man of means and good judgment and under his leadership an intensive building program was initiated. The town built by Dyer in the midst of the group of Bavarian farmers was known as Dyersville as early as February 13, 1849.
The panics and depression of 1857 and 1873 caused many of the English to leave for more promising places. As the migration of the English continued, they sold farms, homes, and stores to German settlers.
In 1888, many farmers and merchants mortgaged their properties to build a new Catholic church large enough to hold one thousand people. Pope Pius XII elevated St. Francis Xavier Church to the rank of a Minor Basilica in 1956. The Basilica of St. Francis Xavier was recently restored at a cost of over $1 million. It was recently featured on EWTN, a Catholic Television Network, and remains the destination for thousands of visitors each year. With its twin spires topped by gold crosses, the Basilica remains the most predominant edifice in Dyersville.
In 1945, Fred Ertl, Sr. began to make scale models of farm tractors using molds he created and fired in his basement furnace. This hobby led to a family business and eventually to the Ertl Company, which produced toy tractors and farm implements. The popularity of these toys over the years has supported
two large toy shows, which are held every June and November. Dyersville is now known as the "Farm Toy Capital of the World" and is home to the National Farm Toy Museum.
In 1982, screenwriter Phil Robinson became interested in the novel "Shoeless Joe." He recognized the potential for this heartwarming story and looked for a setting for the film. In the early months of 1988, Robinson came upon the Lansing farm near Dyersville and said, "That's it! That's my farm!" The movie produced was called "Field of Dreams," starring Kevin Costner and James Earl Jones. Today the site is well maintained and visited by many baseball enthusiasts.
Dubuque
Iowa's oldest city, Dubuque was established in 1833 on the bluffs of the Mississippi River. Settled in 1788 by French Canadian fur trader and early entrepreneur Julien Dubuque, this has been a vibrant river city since the early 1800s. Historically known for button making, boat building and logging, today Dubuque is a thriving city, known for its riverboat excursions, tourism, gambling and recreation. Dubuque serves as the major retail, medical, education and employment center for an estimated 250,000 people in the tri-state area. The community has a stable and diversified manufacturing base, a growing service sector, and a significant increase in technology based companies. Dubuque also has key employment in publishing, health care, tourism and education.
In the early 1900s, most of Dubuque was located below the bluffs in the historic floodplain of the Mississippi River. This development pattern did not substantially change until the 1950s and 1960s, when westward expansion for industry, commercial and residential development continued until the 1980s. The community then worked to expand and diversify its local economy with new transportation and communication connections. During the 1990s, local industries were relocated to new industrial parks and new residential developments began on the south and west ends. With construction of the Northwest Arterial (Highway 32) the new commercial retail center shifted further west. Dubuque's riverfront was dramatically transformed from industrial brownfields to the 90-acre campus of the America's River Project. Dubuque annexed thousands of acres to provide opportunities for additional residential, commercial and industrial growth. There also has been a continuing trend of redevelopment in the downtown and surrounding commercial and residential areas, such as the Washington and North End Neighborhoods and the Historic Dubuque Millwork District.
Community Character
The Dubuque 2026 Vision Statement: The City of Dubuque is a progressive, sustainable city with a strong diversified economy and expanding global connections; the Dubuque community is an inclusive community celebrating culture and heritage and has actively preserved our Masterpiece on the Mississippi; Dubuque citizens experience healthy living and active retirement through quality, livable neighborhoods and an abundance of fun things to do and they are engaged in the community, achieving goals through partnerships; and Dubuque City government is financially sound and providing services with citizens getting value for their tax dollars.
The City's mission statement is: to deliver excellent municipal services that support urban living, and contribute to a sustainable city. The City plans for the community's future, and facilitates access to critical human services. The result is a financially sound city government and citizens getting services and value for their tax dollar.
Dubuque has a city manager form of government, with the City Manager reporting to the Mayor and City Council. The City's annual operating and capital budget is over $181 million and funds a full range of municipal services. The City has more than 680 FTE employees. The City of Dubuque provides public safety, public works, health, engineering, cultural, recreation, community development, housing, planning, zoning, inspection, community and economic development services to its citizens. The City provides water, sanitary sewer, storm sewer, solid waste collection, parking, transit, civic center, convention center, golf course, parks, pools, trails, cable TV programming, public library and airport operations. The City operates the sanitary landfill with Dubuque County. The City's web site is www.cityofdubuque.org.
Epworth
With a 2010 Census population of 1,860, Epworth is located in the center of Dubuque County about fourteen miles west of Dubuque and ten miles east of Dyersville on US 20.
The first white settlement in the vicinity of Epworth came around 1837, although little actual growth was experienced until the surveying of the railroad in 1855. The first local industry, a brick manufacturer, was established in 1854. Other shops and trade stores soon followed that were appropriate for the times. After some rough times early on and the pressures of the Civil War, Epworth became an incorporated town of record in 1880. Prosperity and renewed growth emerged. Churches and schools were the focal point for the community. Community services and facilities followed including a telephone system and seminary additions. By 1900, the town's population had risen to 550. Fire plagued the town in the first two decades of the 20th century and most of the downtown had to be rebuilt after disasters in 1903 and 1911. This created considerable interest in the necessity for a community wide water system and the organization of the volunteer fire department. Effects of national and international events over the next 30 years influenced Epworth similar to other communities. The population stabilized, economic and manufacturing activity survived or flourished and, over time, further community services were added. Since mid-1960's the construction of housing has provided growth for the community. Its regional proximity to Dyersville and Dubuque has made Epworth a supportive community to the industrial activity of those areas.
With numerous small businesses and a new development area, Epworth is poised for additional growth. The Epworth Fire Department is prided on training and advanced equipment for fire suppression and the highest level of pre-hospital care. The Epworth area enjoys a class 4 insurance rating which results in lower insurance rates. Volunteers and their remarkable efforts position the City as the place to live. Epworth offers a variety of opportunities, where church, social and civic activities intermix to give residents a basic sense of belonging and working together for their common benefit. Our Gateway Center was built in year 2000 as a landmark to the spirit and pride of our community and its founders. It is a symbol of unity of people of all faiths and all ages, and we hope that it welcomes you to our community.
The City of Epworth, its citizens, and its stakeholders envision a community that continues to build upon its strengths and leverage those strengths to branch out. The community continues to provide an atmosphere conducive to a wide variety of living styles – from young individuals starting out, families, and retired persons. This atmosphere includes attractive parks, walking and biking trails, abundant recreational and cultural opportunities, a strong school system, well-maintained streets and infrastructure, exceptional fire and police protection, and abundant, quality housing. The business community in Epworth is growing, offers employment opportunities for the community, and serves to complement the community's atmosphere. City government is cognizant of the varying needs of residents and businesses alike, in addition to being financially sound. Epworth is a community where people will seek to live, work, and operate a business because of its atmosphere and opportunities.
Farley
Farley is located in the western half of Dubuque County along US 20. Like many communities across the country, Farley can trace its humble beginnings to the construction of a railroad line through the area. At the point where the Dubuque Southwestern Railroad met the Dubuque and Pacific road, a depot was built in the late 1850’s. A town was platted, property purchased and businesses began to spring up. By the time the town became incorporated in 1879, 129 settlers called Farley their home. Today Farley is home to 1,550 residents.
Transportation played an important role in the City’s history and still does today. Many residents built homes and raised families in Farley, traveling to nearby Dubuque or Dyersville for employment or shopping. More recently, the city's industrial base has thrived, with manufacturers taking advantage of Farley’s unique proximity to a four-lane highway and the CNN Railroad.
Volunteers play a critical role in Farley’s success—from our park board, to the Farley Development Corporation, fire and ambulance, to our Farley Garden Club whose members beautify Farley with a multitude of flower plantings every year. Through the strong sense of community spirit and volunteer efforts by its citizens, as well as a proactive vision by community leaders, Farley has enjoyed smart, balanced growth and is poised for even greater prosperity in the future.
Garden Club whose members beautify Farley with a multitude of flower plantings every year. Through the strong sense of community spirit and volunteer efforts by its citizens, as well as a proactive vision by community leaders, Farley has enjoyed smart, balanced growth and is poised for even greater prosperity in the future.
A strong relationship between the Farley Development Corporation, local entrepreneurs and the City, contributed to the steady growth of Farley's two industrial parks—with employment topping more than 300. Achieving a balance between commercial and residential growth became a reality with the development of the Southlake subdivision in the late 1990s. To date, more than 70 new homes have been built in Southlake.
Quality of life and recreational opportunities have always served as a source of pride in Farley. The city park includes four ball fields, including the home fields for the Western Dubuque Bobcat boys' and girls' baseball and softball teams. It also features two large shelters and four small ones, plenty of room for family reunions and gatherings. Lots of trees and playground equipment including tennis, basketball, volleyball and horseshoes are close by. Our Westside park boasts playground equipment and picnic facilities. For the bicycle enthusiast, we have a new ½ mile bike lane on the road leading north out of town, connecting to the 26-mile Heritage Trail.
The Farley Memorial Hall was built in 1939 during the Great Depression using the New Deal's Work Projects Administration (WPA) funding. This two-story community center features a dance floor and stage upstairs and a kitchen-reception area downstairs. It holds more than 500 people and has served as the center of family and organizational gatherings for generations. Also downtown, you can dine out at four different places.
In the summertime, besides baseball and softball, one can hear the sounds of the stock cars at the Farley Speedway on Friday nights. This dirt track draws fans from all around eastern Iowa. The raceway grounds are also home to the Palace Ballroom, an additional venue to host family celebrations or business events.
Farley serves as the home for both the Seton Catholic middle school, Western Dubuque Schools public pre K-4 elementary and middle school. Drexler Middle School recently completed a major remodeling, which included an addition of a new gymnasium, and the Dubuque County Library that serves the School, City and County.
Community Character
The community's connection to agriculture has always been strong and is the home of an implement dealer, feed store, grain elevator, veterinary services and tire repair.
Through 2011, the city invested more than $8 million in infrastructure projects over the previous ten years, including a new waste water treatment plant, a second water tower, reconstruction of First Avenue and First Street, plus the purchase and remodeling of city offices and maintenance shop.
Peosta
Peosta was the name of a Fox Indian chief who had a daughter named Petosa. In the late 1700s, Petosa became the wife of a French entrepreneur named Julien Dubuque.
Peosta (formerly known as Caledonia) in Vernon Township was laid out in 1853 by Simeon Clark and Elisha Brady on a tract of thirty acres along the railroad line. Methodist, Presbyterian and Campbellite churches were started early. A hotel was built in 1857. Peosta was incorporated on July 14, 1933.
Between 1933 and 1990, Peosta grew at a modest pace. In 1992, two developers purchased farmland and began developing Royal Oaks and Peosta Acres subdivisions. Since that time, both of these subdivisions have expanded. Gingerbread Ridge, Parkview Estates, Royal Oaks East and Kelly Oaks subdivisions are also being developed, providing the potential for many more people to enjoy the benefits of a small community that has a lot to offer.
According to the 2010 census, the city had a population of 1,377; Peosta is also home to a large industrial park boasting 40 plus businesses employing about 2,000 employees. Northeast Iowa Community College has a campus in Peosta with approximately 2,300 students.
The Peosta Community Centre (PCC) opened its doors in 2005; this 75,000 square foot facility was built by A.J. Spiegel and donated to the City. The PCC has state-of-the-art fitness equipment including cardio and weights and offers more than 30 fitness classes each week. There are also basketball, tennis and volleyball courts plus two racquetball courts that appeal to all age groups. The banquet room is used for many wedding receptions and other large events held throughout the year. City Hall is also housed within the facility.
classes each week. There are also basketball, tennis, and volleyball courts plus two racquetball courts that appeal to all age groups. The banquet room is used for many wedding receptions and other large events held throughout the year. City Hall is also housed within the facility.
Mr. Spiegel also donated land to the City to build a baseball diamond that is used by the Peosta Cubs semi-pro team and also serves as Clarke University’s home field. There are also two Little League diamonds that are used for many youth teams in the area.
There are two elementary schools that call Peosta home: Peosta Elementary houses pre-K through 4th grade and Seton Catholic School has children from pre-K through 5th grade attending their center.
Goals and Objectives
- Invest in existing places such as downtowns, infrastructure, neighborhoods, and places that the community values.
- Prioritize funding for repair and maintenance of existing infrastructure before building new.
- Encourage economic development in existing downtowns.
- Rehabilitate existing buildings in a way that preserves their historic significance while meeting modern needs such as office space, retail, or apartments.
- Encourage private sector investment by providing incentives for infill development.
- Create great new places in areas that are designated for new development.
- Identify designated growth areas that the community sees as best suited for new development.
- Consider design guidelines that preserve distinctive local character in new development.
- Consider policies that promote the development of compact, walkable, mixed-use places.
- Plan for new parks and open spaces to serve new development.
- Encourage developers to build great places by using smart growth and green building approaches.
- Preserve the agricultural natural character of the region.
- Develop land and economic development strategies that preserve working farms, natural landscapes, and scenic vistas that represent a community's character.
- Encourage land use policies and regulations that do not hamper family farm operations.
- Promote rural products in urban areas through buy local campaigns and farmers' markets.
- Safeguard the cultural and historic resources of each community as critical to the quality of life and the attractiveness of the region.
- Promote the preservation of historic buildings and architectural resources with emphasis in areas of greatest need.
- Encourage educating the community about the benefits of historic preservation to quality of life, economic development efforts, tourism, and tax base enhancement.
- Encourage exploration, preservation, and interpretation for present and future generations, the history of the region's communities and the Mississippi River.
- Promote increased appreciation, education, technical assistance, and funding to preserve historical, architectural, and archeological heritage.
- Encourage the development of a marketing plan for the cultural and historic resources in the region.
- Identify the location of existing historical and archaeological sites in order to buffer nearby future development if necessary, to preserve the character of a site.
- Consider development regulations that will protect significant undiscovered archaeological sites, such as ancient burial mounds, from disruption.
Community Overview
This chapter includes a summary of the current demographic and economic conditions in each community, and future forecasts for total population and employment. The data presented in this chapter will be used to assess the strengths and weaknesses of each community and the region as a whole. Consortium members will use this information to create goals and objectives that will build on community strengths and address any weaknesses.
The majority of the data in this chapter comes from the US Census Bureau's American Community Survey (ACS) 5-year estimates. The ACS is based on a questionnaire that is sent each month to a sample of about 250,000 addresses in the United States. Each calendar year, these data are pooled and estimates are produced for about 60 different social, economic, and housing characteristics. Since the size of a geographic area largely determines the size of the sample, only larger areas—those with 65,000 or more people—receive 1-year estimates. For smaller places, estimates are created for multiyear periods: for areas with populations between 20,000 and 65,000, 3 years of data are needed; and for areas with fewer than 20,000 people, 5 years of data need to be collected in order to provide estimates.
Community Character
All survey and census estimates include some amount of error. Estimates generated from sample survey data have uncertainty associated with them because they are based on a sample of the population rather than the full population. This uncertainty, referred to as sampling error, means that the estimates derived from a sample survey will likely differ from the values that would have been obtained if the entire population had been included in the survey, as well as from values that would have been obtained had a different set of sample units been selected.
Community Overview
Dubuque County, Iowa
Population
2010 Dubuque County Population
Race and Ethnicity
Dubuque County Race
- White, 94.06%
- Black or African American, 2.65%
- Asian, 0.94%
- Some Other Race, 0.55%
- Other, 3.28%
- Native Hawaiian and Other Pacific Islander, 0.01%
- American Indian and Alaska Native, 0.13%
- Two or More Races, 1.36%
Dubuque County Hispanic or Latino
- Not Hispanic or Latino, 98.07%
- Hispanic or Latino (of any race), 1.93%
Education
Education Population 25 Years and Over
- Doctorate degree: 0.8%
- Professional school degree: 1.6%
- Master's degree: 6.3%
- Bachelor's degree: 16.3%
- Associate's degree: 7.7%
- Some college, 1 or more years, no degree: 12.5%
- Some college, less than 1 year: 6.1%
- High school graduate, GED, or alternative: 38.1%
- Less than high school graduate: 10.6%
According to the 2010 Census, the population of Dubuque County is 93,653. For most of the last 150 years, Dubuque County's population has grown steadily. During the farm crisis of the 1980s, the County lost population. Since 1990 the County has experienced positive population growth. The pattern of positive growth is expected to continue over the next 30 years. According to population projections produced by the Consortium, Dubuque County's population will reach 122,000 by the year 2040. While Dubuque County's population continues to become more diverse, racial and ethnic minority groups make up a small percentage of the County's population, approximately 6%. According to the US Census Bureau, 38% of residents 25 and older have a high school diploma and 33% have a college degree. Nationally, 29% have graduated high school and 34% have a college degree.
Community Character
Area: 616.64 sq mi
2010 Population: 93,653
Population Density: 152 persons per sq mi
Employment
Housing
Total Occupied Housing Units: 36,815
Owner-Occupied Units: 26,969
Renter-Occupied Units: 9,846
Median Year Structure Built: 1963
Median Value of Owner-Occupied Units: $131,400
Data Source: US Census Bureau, 2010
* Data Source: US Census Bureau, ACS 5-year Estimate, 2005-2009
Income
Median Household Income: $48,012 (2009 Dollars)
Data Source: US Census ACS 5-Year Estimate, 2005-2009
According to the US Bureau of Labor Statistics (BLS), Dubuque County's seasonally adjusted employment total for August 2011 was 57,400. Employment growth is expected to continue over the next 30 years. Employment is expected to reach 72,000 by 2040, based on a forecast developed for Dubuque County by Regional Economic Model, Inc. Since 2000 Dubuque County's unemployment rate has mirrored the State of Iowa's rate. Based on the BLS data, both Dubuque County and the State of Iowa have fared well in the recession. Current unemployment rates are approximately 3 percentage points lower than the national average. The price of owner-occupied housing tends to be less than the national average. The median home price for Dubuque County is about $48,000 less than the national median of $179,900. Dubuque County's median household income is $48,012; just under the national median household income of $51,425.
Community Overview
City of Asbury, Iowa
Population
Race and Ethnicity
Education
Asbury residents tend to be younger than the rest of the county. Median age is 35.6 compared to 38.6 for the county. The 2010 population pyramid shows large numbers in the 30-44 and the 5-19 age groups. This indicates the presence of many young families. Asbury has experienced rapid population growth over the last 60 years. Starting at just 27 residents in 1940, the city has grown to 4,170 residents. Asbury's rapid expansion is expected to continue over the next 30 years. According to projections, the city's population will top 9,000 by 2040. Whites make up about 97% of Asbury's population. Countywide, whites make up about 94%. Education levels in Asbury are higher than in the rest of the county. 50% of residents have a college degree.
Community Character
| Area: | 3.12 sq mi |
|---|---|
| 2010 Population: | 4,170 |
| Population Density: | 1,337 persons per sq mi |
| Housing | |
|---|---|
| Total Occupied Housing Units: | 1,463 |
| Owner-Occupied Units: | 1,262 |
| Renter-Occupied Units: | 171 |
| Median Year Structure Built:* | 1995 |
| Median Value of Owner-Occupied Units* | $161,700 |
| Data Source: US Census Bureau, 2010 * Data Source: US Census Bureau, ACS 5-year Estimate, 2005-2009 |
Employment
Employment Status of Asbury Residents
Data Source: US Census Bureau, 1990, 2000, 2009*
Unemployment has decreased from around 5% in 1990 to 1.5% in 2009. 74% of Asbury residents work in management, professional, sales, and office occupations. Asbury home prices tend to be higher than the rest of the county. The Asbury median home price is $30,300 higher than the County median. Median household income is $27,000 higher than the rest of the County.
Community Overview
City of Cascade, Iowa
Population
Race and Ethnicity
White, 96.20%
Some Other Race, 2.50%
Black or African American, 0.42%
Other, 1.30%
American Indian and Alaska Native, 0.09%
Asian, 0.19%
Native Hawaiian and Other Pacific Islander, 0.23%
Two or More Races, 0.37%
Education
The median age in Cascade is 38.7 compared to 38.6 for the County. The 2010 population pyramid is about as wide on top as it is on the bottom. This indicates that Cascade is an older, established city. Cascade has experienced steady population growth over the last 100 years. Population declined in the 1980s, but has since returned to a positive growth pattern. Cascade's steady growth is expected to continue over the next 30 years. According to projections, the City's population will top 2,700 by 2040. Whites make up about 96% of Cascade's population. County wide, whites make up about 94%. Education levels in Cascade are similar to the rest of the County. 29% of residents have a college degree.
Community Character
| Area: | 1.89 sq mi |
|---|---|
| 2010 Population: | 2,159 |
| Population Density: | 1,142 persons per sq mi |
Employment
Employment Status of Cascade Residents
Cascade Employment by Industry
Housing
Total Occupied Housing Units: 880
Owner-Occupied Units: 630
Renter-Occupied Units: 250
Median Year Structure Built: * 1974
Median Value of Owner-Occupied Units*: $117,800
Data Source: US Census Bureau, 2010
* Data Source: US Census Bureau, ACS 5-year Estimate, 2005-2009
Income
Median Household Income: $51,193 (2009 Dollars)
Data Source: US Census ACS 5-Year Estimate, 2005-2009
Unemployment has decreased from 3.6% in 1990 to 1.1% in 2009. 49% of Cascade residents work in management, professional, sales, and office occupations. 29% work in production, transportation and material moving occupations. Cascade home prices tend to be lower than the rest of the County. The median home price in Cascade is $13,600 lower than the County median. Median household income is about $3,000 higher than the rest of the County.
Community Overview
City of Dubuque, Iowa
Population
Race and Ethnicity
- White, 91.73%
- Black or African American, 3.99%
- Other, 4.28%
- Asian, 1.14%
- Two or More Races, 1.17%
- Some Other Race, 0.46%
- Native Hawaiian and Other Pacific Islander, 0.46%
- American Indian and Alaska Native, 0.27%
Dubuque Hispanic or Latino
- Not Hispanic or Latino, 97.60%
- Hispanic or Latino (of any race), 2.40%
Education
- Doctorate degree: 1.0%
- Professional school degree: 1.5%
- Master's degree: 7.2%
- Bachelor's degree: 16.7%
- Associate's degree: 6.4%
- Some college, 1 or more years, no degree: 12.9%
- Some college, less than 1 year: 5.7%
- High school graduate, GED, or alternative: 37.0%
- Less than High School graduate: 11.6%
The median age in Dubuque is 38.7 compared to 38.6 for the County. The 2010 population pyramid shows large numbers in the 20-24 age group, indicating the city's college population, and the 45-59 age group, indicating a large baby boomer population nearing retirement age. Dubuque has experienced steady population growth over the last 150 years. Population declined in the 1980s, but has since leveled off to a slow growth pattern. With new economic development activities, Dubuque's growth rate is expected to increase over the next 30 years. According to projections, the City's population will top 75,000 by 2040. Whites make up about 92% of Dubuque's population. Countywide, whites make up about 94%. Education levels in Dubuque are similar to the rest of the County. 33% of residents have a college degree.
Community Character
| Area: | 31.35 sq mi |
|---|---|
| 2010 Population: | 57,637 |
| Population Density: | 1,839 persons per sq mi |
| Housing | |
|---|---|
| Total Occupied Housing Units: | 23,506 |
| Owner-Occupied Units: | 15,446 |
| Renter-Occupied Units: | 8,060 |
| Median Year Structure Built:* | 1956 |
| Median Value of Owner-Occupied Units* | $117,900 |
| Data Source: US Census Bureau, 2010 * Data Source: US Census Bureau, ACS 5-year Estimate, 2005-2009 |
Employment
Employment Status of Dubuque Residents
Data Source: US Census Bureau, 1990, 2000
Data Source: US Census Bureau, ACS 5-year Estimate, 2005-2009
Entertainment, Accommodation, and Food Services
Median Household Income:
$41,879 (2009 Dollars)
Data Source: US Census ACS 5-Year Estimate, 2005-2009
Unemployment remained around 5% between 1990 and 2009. 57% of Dubuque residents work in management, professional, sales, and office occupations. 15% work in production, transportation, and material moving occupations. Dubuque home prices tend to be lower than the rest of the county. The median home price in Dubuque is $13,500 lower than the county median. Median household income is about $6,000 lower than the rest of the county.
Community Overview
City of Dyersville, Iowa
Race and Ethnicity
Dyersville Race
White, 97.61%
Other, 2.39%
Asian, 0.22%
Some Other Race, 0.42%
Black or African American, 0.31%
Native Hawaiian and other Pacific Islander, 0.02%
Two or More Races, 0.51%
Dyersville Hispanic or Latino
Not Hispanic or Latino, 98.69%
Hispanic or Latino (of any race), 1.31%
Population
Education
The median age in Dyersville is 40.0 compared to 38.6 for the county. The 2010 population pyramid is about as wide on top as it is on the bottom. This indicates that Dyersville is an older, established city. Dyersville has experienced steady population growth over the last 100 years. Population declined in the 1980s, but has since leveled off to a slow growth pattern. With new economic development activities, Dyersville's growth rate is expected to increase over the next 30 years. According to projections, the City's population will near 5,000 by 2040. Whites make up about 98% of Dyersville's population. County wide, whites make up about 94%. Education levels in Dyersville are similar to the rest of the County. 33% of residents have a college degree.
Community Character
| Area: | 5.93 sq mi |
|---|---|
| 2010 Population: | 4,058 |
| Population Density: | 684 persons per sq mi |
Housing
| Housing | |
|---|---|
| Total Occupied Housing Units: | 1,700 |
| Owner-Occupied Units: | 1,377 |
| Renter-Occupied Units: | 323 |
| Median Year Structure Built:* | 1961 |
| Median Value of Owner-Occupied Units* | $120,600 |
| Data Source: US Census Bureau, 2010 * Data Source: US Census Bureau, ACS 5-year Estimate, 2005-2009 |
Income
Median Household Income: $55,476 (2009 Dollars)
Data Source: US Census ACS 5-Year Estimate, 2005-2009
Employment
Employment Status of Dyersville Residents
Data Source: US Census Bureau, 1990, 2000
Unemployment decreased from 4.2% in 1990 to 1.2% in 2009. 52% of Dyersville residents work in management, professional, sales, and office occupations. 23% work in production, transportation, and material moving occupations. Dyersville home prices tend to be lower than the rest of the County. The median home price in Dyersville is $10,800 lower than the county median. Median household income is about $7,500 higher than the rest of the County.
Community Overview
City of Epworth, Iowa
Population
Race and Ethnicity
Epworth Race: White, 93.52%; Black or African American, 0.76%; Asian, 4.78%; Other, 1.29%; Some Other Race, 0.32%; Two or More Races, 0.22%
Education
The median age in Epworth is 33.1 compared to 38.6 for the County. The 2010 population pyramid is much narrower at the top than at the bottom. This indicates that Epworth is a younger city that is growing through immigration. Epworth has experienced rapid population growth over the last 50 years. Population declined in the 1980s, but has since returned to a positive growth pattern. Epworth's positive growth rate is expected to continue over the next 30 years. According to projections, the City's population will reach 2,851 by 2040. Whites make up about 94% of Epworth's population, which is the same as the countywide percentage. Education levels in Epworth are slightly lower than the rest of the County. 28% of residents have a college degree.
Community Character
Area: 1.58 sq mi
2010 Population: 1,860
Population Density: 1,177 persons per sq mi
Employment
| Housing | |
|---|---|
| Total Occupied Housing Units: | 643 |
| Owner-Occupied Units: | 544 |
| Renter-Occupied Units: | 99 |
| Median Year Structure Built:* | 1975 |
| Median Value of Owner-Occupied Units* | $121,200 |
| Data Source: US Census Bureau, 2010 * Data Source: US Census Bureau, ACS 5-Year Estimate, 2005-2009 |
Median Household Income: $55,737 (2009 Dollars)
Data Source: US Census ACS 5-Year Estimate, 2005-2009
Employment Status of Epworth Residents
Data Source: US Census Bureau, 1990, 2000
* Data Source: US Census Bureau, ACS 5-Year Estimate, 2005-2009
Unemployment decreased from 6.3% in 1990 to 2.2% in 2009. 46% of Epworth residents work in management, professional, sales, and office occupations. 21% work in production, transportation and material moving occupations. Epworth home prices tend to be lower than the rest of the County. The median home price in Epworth is $10,200 lower than the County median. Median household income is about $7,700 higher than the rest of the County.
Community Overview
City of Farley, Iowa
Population
Race and Ethnicity
Education
The median age in Farley is 33.8 compared to 38.6 for the County. The 2010 population pyramid is much narrower at the top than it is on the bottom. This indicates that Farley is a younger city that is growing through immigration. Farley has experienced steady population growth over the last 100 years. Population declined in the 1980s, but has since returned to a positive growth pattern. Farley's positive growth rate is expected to continue over the next 30 years. According to projections, the City's population will near 2,000 by 2040. Whites make up about 99.35% of Farley's population. County wide, whites make up about 94%. Education levels in Farley are slightly lower than the rest of the County. 25% of residents have a college degree.
Community Character
| Area: | 1.61 sq mi |
|---|---|
| 2010 Population: | 1,537 |
| Population Density: | 955 persons per sq mi |
| Housing | |
|---|---|
| Total Occupied Housing Units: | 575 |
| Owner-Occupied Units: | 479 |
| Renter-Occupied Units: | 96 |
| Median Year Structure Built:* | 1968 |
| Median Value of Owner-Occupied Units* | $114,700 |
| Data Source: US Census Bureau, 2010 * Data Source: US Census Bureau, ACS 5-Year Estimate, 2005-2009 |
| Income | |
|---|---|
| Median Household Income: | $51,425 (2009 Dollars) |
Employment Status of Farley Residents
Unemployment declined from 4.4% in 1990 to 4.2% in 2009. 47% of Farley residents work in management, professional, sales, and office occupations. 25% work in production, transportation and material moving occupations. Farley home prices tend to be lower than the rest of the County. The median home price in Farley is $16,700 lower than the County median. Median household income is about $3,400 higher than the rest of the County.
Community Overview
City of Peosta, Iowa
Population
Race and Ethnicity
Education
The median age in Peosta is 30.2 compared to 38.6 for the County. The 2010 population pyramid is much narrower at the top than it is on the bottom. This indicates that Peosta is a city with many young families that is growing rapidly through immigration. Peosta has experienced rapid population growth over the last 20 years. Between 1990 and 2010 the City's population expanded by 920%. Peosta's positive growth rate is expected to continue over the next 30 years. According to projections, the City's population will near 3,750 by 2040. Whites make up about 96.9% of Peosta's population. County-wide, whites make up about 94%. Education levels in Peosta are higher than the rest of the County. 57% of residents have a college degree.
Community Character
| Area: | 2.07 sq mi |
|---|---|
| 2010 Population: | 1,377 |
| Population Density: | 665 persons per sq mi |
| Housing | |
|---|---|
| Total Occupied Housing Units: | 438 |
| Owner-Occupied Units: | 371 |
| Renter-Occupied Units: | 67 |
| Median Year Structure Built:* | 1998 |
| Median Value of Owner-Occupied Units* | $189,100 |
| Data Source: US Census Bureau, 2010 * Data Source: US Census Bureau, ACS 5-Year Estimate, 2005-2009 |
Employment
Employment Status of Peosta Residents
Data Source: US Census Bureau, 1990, 2000, 2009 • Data Source: US Census Bureau, ACS 5-Year Estimates, 2005-2009
Peosta Employment by Industry
Value of Owner-Occupied Housing
Value (Thousands of Dollars)
Median Household Income: $79,773 (2009 Dollars)
10-14 15-19 20-24 25-29 30-34 Thousands of Dollars
35-39 40-44 45-49 50-59 60-74 75-99 100-124 125-149 150-199 200+
Data Source: US Census ACS 5-Year Estimate, 2005-2009
Unemployment remained around 3% from 1990 to 2009. 69% of Peosta residents work in management, professional, sales, and office occupations. 13% work in production, transportation and material moving occupations. Peosta home prices tend to be higher than the rest of the County. The median home price in Peosta is $57,700 higher than the County median. Median household income is about $31,761 higher than the rest of the County.
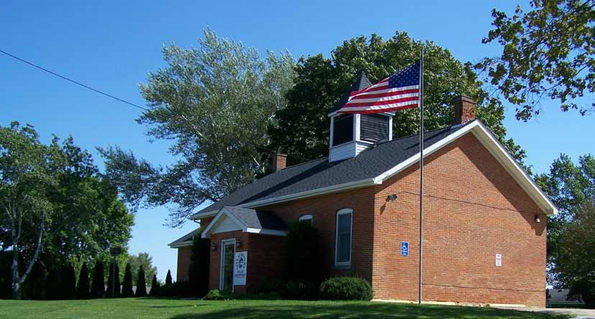
Chapter 4
When choosing a community to live in, the community facilities that serve residents' basic needs are an important factor. Education, safety, and health care are factors that potential residents and employers look at when choosing where to live or locate a business. In many cases, the needs for community facilities cross municipal boundaries, and as a result, regional intergovernmental coordination and coordination between the public and private sectors is fundamental to providing the best quality community facilities. Improved coordination allows communities to combine resources to eliminate duplication of services and achieve economies of scale.
Intergovernmental coordination is already occurring across the region. Local governments within the region have mutual aid agreements for fire and police services and both public school districts serve multiple communities. Coordination between the public and private sector facility providers is also imperative. Private entities in Dubuque County provide education, emergency medical services, hospital services, and childcare facilities. Local governments need to work with private facility providers to provide the highest level of service to their residents.
The goal of this chapter is to guide communities in providing high quality community facilities to all residents of Dubuque County by maintaining the existing intergovernmental and public-private facilities relationships, and looking for areas to establish new relationships. This chapter will provide an inventory of the Dubuque County's community facilities, as they exist today, and will then provide a list of goals and objectives that will help the region provide the best quality community facilities to its residents. The region's primary community facilities are included in Maps 4.1 through 4.7 at the end of the chapter.
Education
There are two public school districts within Dubuque County: Dubuque Community School District (DCSD) and Western Dubuque Community School District (WDCSD). The Dubuque Community School District provides Pre-K through 12 education for children in the cities of Dubuque, Asbury, Durango, Graf, Sageville, Sherrill, and the eastern half (approximate) of Dubuque County. Dubuque Community School District operates fourteen elementary schools, three middle schools, and two high schools.
The Western Dubuque Community School District provides Pre-K through 12 education for the western half of Dubuque County including: Balltown, Rickardsville, Centralia, Peosta, Bankston, Holy Cross, Luxemburg, New Vienna, Epworth, Farley, Dyersville, Worthington, Cascade, and Bernard. WDCSD operates six elementary schools, two middle schools, and two high schools.
Figure 4.1 - Dubuque County School Enrollment 2011
| School Enrollment | Dubuque Community | Western Dubuque Community | Holy Family Catholic Schools | Private Schools in Western Dubuque |
|---|---|---|---|---|
| Elementary | 4,675 | 1,174 | 818 | 890 |
| Middle School | 2,382 | 578 | 457 | 280 |
| High School | 3,298 | 1,036 | 586 | 340 |
| Total | 10,355 | 2,788 | 1,861 | 1,510 |
Source: Dubuque Community Schools, Western Dubuque Community Schools, Holy Family Catholic Schools, and the Archdiocese of Dubuque.
In addition to public schools, Dubuque County is home to several private schools. Holy Family Catholic Schools (HFCS) provides pre-K through 12 education in the City of Dubuque. Holy Family currently operates five elementary schools, one middle school, and one high school. A group of catholic schools provides private education in the western half of Dubuque County. Private schools in western Dubuque County include three K-6 schools, two K-8 schools, one K-3 school, one 4-8 school, and one 7-12 high school. Figure 4.1 contains enrollment information for all Dubuque County schools for 2011.
Future Needs
Dubuque Community
4,675 2,382 3,298 10,355
The Dubuque Community School District completed its Long Range Facilities Planning Document for 2012-2025 in December of 2011. The goal of the plan is to provide a comprehensive facilities plan that will ensure district facilities are safe, secure, accessible, and functional and can meet the educational needs for all learners in a 21st century learning environment. The plan outlines improvements for every building and site in the district. Improvement projects were prioritized based on several parameters including: enrollment and demographic information, financials, feedback from the community, educational needs, and individual building plans. The plan will be reviewed annually and will be revised as conditions change.
Western Dubuque Community School District contracted with Key Concepts, LLC., to produce a facilities study in 2008. Information used in the study was based on the District’s 2007-2008 school year, and was provided by the US Census Bureau, the WDCSD, the Iowa Department of Management, the Iowa Department of Education, and the Iowa Association of School Boards. Census data indicated population growth in the district, with the fastest growth occurring in the City of Peosta. The study noted recent enrollment increases at Peosta and Epworth schools, and declining enrollment at Cascade Jr./Sr. High. The report presented seven organizational concepts, along with analysis of the costs and benefits associated with each. Since the publication of the facilities study, the district has taken on several construction projects including Drexler Middle School in Farley, construction of a new elementary school in Dyersville, and an expansion of Cascade Elementary School. WDCSD has also adopted a new school attendance center boundary map.
In February 2011, Holy Family Catholic Schools released a demographic analysis that was compiled by Alta Vista Research, Inc. The report included analysis of data from multiple sources including Iowa Vital Statistics, Woods and Poole (Trends and Predictive Data), American Community Survey, Iowa Department of Education, Iowa Bureau of Planning, Research and Evaluation, and Holy Family Catholic Schools Data. The report presented the following conclusions from the analysis.
- While population in Iowa is growing in general, the greatest growth areas are Hispanic and other non-Caucasian demographics, as well as geographic areas.
- Private schools' share of students in Iowa has trended down over the last 25 years.
- HFCS's share of students has also gone down, but may have stabilized somewhat recently.
- Most population growth in the area has been in communities near Dubuque but not in Dubuque per se.
- Some surrounding towns frequently referred to as 'bedroom communities,' have seen significant growth.
Community Facilities
growth in the last 10 years. Two examples include Asbury and Peosta.
- External factors such as significant changes in state funding for pre-K programs, school consolidation in public or parochial schools, and tuition rates in the Holy Family System could all have major impacts to the local level that are difficult to predict and model.
- The current economy is working against private schools, including HFCS, from the standpoint of making the cost of private education more challenging to keep affordable for lower and middle income brackets.
Colleges and Universities
Loras College is a Catholic liberal arts college located in Dubuque that was established in 1839. Loras College offers undergraduate degrees in over forty areas of study, and several graduate degrees. Total enrollment at Loras College for the 2010-2011 school year was 1,565.
Clarke University was founded in 1843 in Dubuque by Sister Mary Frances Clarke. Originally founded as a liberal arts college for women, Clarke University has expanded and now offers over forty undergraduate and five graduate programs to both men and women. Clarke University's official enrollment for the 2009-2010 school year was 1,202.
The University of Dubuque was originally established as a seminary in 1856. Over time, the curriculum was expanded and a liberal arts college was established. The college officially became the University of Dubuque in 1920. Today, the University of Dubuque offers twenty-four undergraduate majors and five graduate majors. In 2008, the University of Dubuque had an official enrollment of 1,451.
Northeast Iowa Community College (NICC) is a two-year community college with locations across Northeastern Iowa. NICC has three locations in Dubuque County: Dubuque Center for Education in Dubuque, Town Clock Center for Professional Development in Dubuque, and the Peosta Campus in Peosta. NICC offers Associate's degrees, GED preparation, English literacy classes, and adult transition services. The Town Clock Center is a full-service learning and conference center offering non-credit personal and professional development opportunities for individuals as well as customized sessions designed for businesses, organizations, and community groups.
Based in Epworth, Iowa, Divine Word College is a Roman Catholic seminary that educates men and women for missionary service as priests, brothers, sisters, and laypersons. Divine Word offers an education that combines spiritual education, a liberal arts curriculum, and language learning. Established in 1931, Divine Word College today offers three major areas of study and the Intensive English Language Institute.
Emmaus Bible College, originally established in Toronto, Canada in 1938, moved to Dubuque in 1984. All students who attend Emmaus earn a Bible major. Students may also add a second major in Elementary Education, Computer Information Systems, Intercultural Studies, or Youth Ministries. Currently, 250 students are enrolled at Emmaus Bible College.
Established in 1854, Wartburg Theological Seminary is an Evangelical Lutheran seminary that trains students to become leaders in the Lutheran Church. The Seminary campus is located on the southwest side of Dubuque, and has an enrollment of approximately 200 students.
Libraries
Dubuque County is served by four public libraries. The Carnegie-Stout Public Library in Dubuque is the largest with a collection of over 270,000 volumes, 600 periodical and newspaper subscriptions, and a wide variety of audio and video materials. Collections of special note are an obituary file dating to the late 1850s and a newspaper index to the Telegraph Herald and other local newspapers. The Dubuque County Library serves the communities of Dubuque County with branches located in Asbury, Epworth, Farley, and Holy Cross. The County Library has agreements to provide library service to communities that do not have their own library. The Peosta Community Library opened in 2011 at NICC, as a joint venture between NICC, the Dubuque County Library and the City of Peosta. The James Kennedy Public Library is located on 1st Avenue East in Dyersville, and the Cascade Public Library is located in downtown Cascade.
Health Care
The Finley Hospital and Mercy Medical Center in the City of Dubuque provide a full range of health care services to Dubuque County residents. The Finley Hospital has 126 staffed beds, 875 employees, and 376 volunteers. Mercy Medical Center is a non-profit Catholic hospital that has 263 beds, and 1,200 staff including a medical staff of 230. In addition to their Dubuque location, Mercy Medical Center operates a 25-bed hospital in the City of Dyersville. Mercy - Dyersville serves 17 rural communities with emergency, acute and skilled care, and offers extensive rehabilitation services, surgery, home care, specialty clinics and more. A 40-bed nursing home and physician practice are also on the campus.
In addition to the two larger hospitals, there are three main physicians' groups in Dubuque County: Medical Associates Clinic and Health Plans, Dubuque Internal Medicine, and Tri-State Independent Physician's Association. These groups provide a broad range of primary care and surgical specialties. Dubuque County is also served by approximately 100 physicians in independent or group practices.
Crescent Community Health Center is a medical and dental clinic located in Dubuque that provides basic (primary) medical and oral health care. Crescent Community Health Center serves individuals and families who are uninsured, underinsured, and those with various types of insurance. The clinic determines service costs for uninsured patients using a sliding fee scale that is based upon the household income and size. Crescent Community Health Center welcomes patients from any area.
Future Needs
The Dubuque County Board of Health identified the needs that are the highest priority for the county in the Community Health Needs Assessment. The Priority Needs identified for Dubuque County are:
- Promote Healthy Behaviors
- Prevent Injuries
- Protect Against Environmental Hazards
- Prevent Epidemics and the Spread of Disease
Community Facilities
- Prepare for, Respond to, and Recover from Public Health Emergencies
- Strengthen Public Health Infrastructure
Child Care
According to Iowa Department of Human Services, there are 40 licensed daycare centers and 120 registered child development homes in Dubuque County. There are also numerous unregistered centers that care for five or fewer children. Registered and licensed childcare centers in Dubuque County have the capacity to care for 4,372 children.
Iowa law limits the number of children a childcare center may provide child care for without a license or registration as a child development home. A provider caring for six or more children must be registered, and a provider caring for seven or more children must be licensed.
Law Enforcement
Dubuque County is served by seven municipal law enforcement agencies and the Dubuque County Sheriff's Department.
Dubuque County Sheriff's Department
The recognized societal obligations of the Dubuque County Sheriff's Office are the preservation of the peace, the prevention of crime, the safeguarding of civil rights, and the maintenance of social order with justice, equity, and freedom for all. The department provides law enforcement service primarily to the rural areas and smaller municipalities of Dubuque County. The divisions of the department consist of patrol, jail, criminal investigation, courthouse security, and civil process.
The Sheriff's Department has a staff of 106 employees. The department consists of seventy full time sworn deputies, eleven part-time correctional officers, eight courthouse security officers, four full time clerical positions, two part-time clerical positions, three full-time control room operators, five maintenance persons, and three ancillary employees.
The Sheriff's Office has jurisdiction in all incorporated and unincorporated areas of Dubuque County and has 28E Mutual Aid agreements with all local police departments in the county.
City of Dubuque Police Department - The Dubuque Police Department is responsible for providing community service and protection, creating a safe and secure environment for the citizens of Dubuque. It also provides for maintenance, materials, supplies, and repairs necessary for the operation of the department at the Dubuque Law Enforcement Center and department vehicles; as well as completing all requirements to maintain its status as an accredited law enforcement agency. Service is provided 24 hours a day, seven days a week.
The Police Department consists of the following sworn staff: one Chief of Police, one Assistant Chief, six Captains, twelve Lieutenants, fifteen Corporals, seventy-four Officers; and civilian staff consisting of one full-time Information Services Support staff, two full-time Confidential Account Clerks, two full-time Records Clerks, two part-time Records Clerks, one full-time Records Supervisor, and one part-time Receptionist.
Asbury Police Department - The Asbury Police Department is located at 4985 Asbury Road. Calls for service are handled by the Dubuque County Sheriff's Office through the Dubuque County Communications Center. The Asbury Police Department provides a number of crime prevention programs including neighborhood watch, operation identification, and vacation home checks.
Cascade Police Department - The Cascade Police Department serves the City of Cascade with emergency and non-emergency services. The services include, but are not limited to police emergency, crime prevention, and education for organizations, civic groups and private business. The Department is involved in an unofficial School Resource Program and works closely with area schools. The police department is based on community oriented police services.
Dyersville Police Department - The Dyersville Police Department is staffed by six full-time officers, three part-time officers, and two bike officers (college interns) during the summer months. Police responsibilities include: traffic enforcement, criminal investigations, dispute mediation, accident investigation, crisis intervention, animal calls, school and youth programs, radar and security checks for businesses, gun safety, and community event support.
Epworth Police Department - The Epworth Police Department has one police officer and occasional part-time officers. The City has mutual aid partnerships with the City of Peosta, the City of Farley and with Dubuque County.
Farley Police Department – The Farley Police Department provides law enforcement services to the City of Farley. One full time officer and one part time officer staff the Department.
Peosta Police Department - Peosta currently has one full-time police chief. The City has also formed mutual aid partnerships with the City of Epworth and Dubuque County. In FY 2012, the Department added a part time (24 hours per week) officer.
Future Needs
The City of Dubuque Police Department has projected that it will need to increase the number of patrol areas from six to seven as the city expands and annexes more land. In 2007, Dubuque adopted a plan to add an additional 14 police officers over a five year period. The last of these officers were added to the force in FY 2011.
Fire and Emergency Medical Services
Fire Departments
The fire departments that serve Dubuque County are responsible for the protection of life and property from fire, the handling of emergencies involving hazardous materials, and responding to natural and manmade disasters as well as semi-emergency situations where time is a critical element in protecting the health and safety of the citizens. The departments also provide maintenance, materials, supplies and repairs necessary for the operation of fire stations and department vehicles. In addition, some departments provide emergency and non-emergency services.
Figure 4.2 - Dubuque County Fire Departments
| Asbury | Bernard |
|---|---|
| Cascade | Centralia-Peosta |
| Dyersville | Dubuque |
| Epworth | Farley |
| Holy Cross | Key West |
| New Vienna | Sherill |
| Worthington |
emergency medical treatment and transport for citizens and visitors to the County. The City of Dubuque Fire Department is the largest with six fire stations and 90 employees. Figure 4.2 lists the fire departments that serve Dubuque County.
Future Needs
The City of Dubuque has looked into the possibility of adding a seventh fire station on the City's west side. New residential and commercial development in the area has created higher demand for fire services. According to the City's Capital Improvement Budget, a Fire and Emergency Response Study was completed in November 2006 by the Matrix Consulting Group. The report stated, "As development occurs, the City should add one additional station and relocate one current station to accommodate the increase in fire department workload. The scenario would consist of adding a station at or near Chavenelle Road to provide service to the west side of the City." To act on this recommendation, the city created a CIP budget item to provide funds to begin preparing the site, with design of the facility anticipated in FY 2015. In fall 2007, the City Council approved a purchase agreement with Dubuque Initiatives for 1.8 acres along the NW Arterial in the Dubuque Industrial Park to provide a site for the new West End fire station.
Community Facilities
Emergency Medical Services
In Dubuque County, emergency medical services are provided by several public and private agencies. Figure 4.3 lists the EMS providers currently operating in Dubuque County.
The Dubuque Law Enforcement and County Emergency Communications Center
The Dubuque Law Enforcement Center (DLEC) is located at 770 Iowa St. in Dubuque. The DLEC was completed in 1974 and houses the Dubuque Police Department, the Dubuque County Sheriff's Office, the Dubuque Emergency Communications Center, and the Dubuque County Jail.
The Dubuque Emergency County Communications Center serves all of Dubuque County. In July
| Name | Service Level | Service Type | City |
|---|---|---|---|
| Bi-County Ambulance Inc | Ambulance | PS | Dyersville |
| Dubuque Fire Department | Ambulance | PS | Dubuque |
| Epworth Community Vol. Firemen Inc. | Ambulance | PS | Epworth |
| Farley Emergency Medical Services, Inc. | Ambulance | EMT - Paramedic | Farley |
| Holy Cross Volunteer Fire Dept | Ambulance | EMT - Paramedic | Holy Cross |
| Asbury Community Fire Department | Ambulance | PS | Asbury |
| Paramount EMS | Ambulance | PS | Dubuque |
| Bernard Rescue Unit, Inc. | Ambulance | PS | Bernard |
| Sherrill Fire Department | Ambulance | PS | Sherrill |
| Centralia/Peosta Emergency Services | Ambulance | EMT - Paramedic | Peosta |
| Key West Fire and EMS | Ambulance | PS | Dubuque |
| Advanced Medical Transport-Dubuque | Ambulance | PS | Dubuque |
| Cascade Emergency Medical Services | Ambulance | PS | Cascade |
| Worthington Community Fire Dept | Non-transport | First Responder | Worthington |
| New Vienna Luxemburg Fire Dept | Non-transport | EMT - Basic | New Vienna |
| Dubuque County Support Service | Non-transport | EMT - Basic | Dubuque |
| Dyersville Fire Department | Non-transport | First Responder | Dyersville |
PS - Paramedic Specialist
Data Source: Iowa Department of Public Health, Bureau of Emergency Medical Services
of 1985 the City of Dubuque and Dubuque County consolidated all public safety communications within Dubuque County into a Joint Public Safety Answering and Dispatch Point (PSAP). The Emergency Communications Center is the answering point for all emergency and non-emergency calls requesting ambulances, fire and law enforcement for the residents of and visitors to City of Dubuque and Dubuque County. The Communications Center will dispatch the proper units and provide appropriate care and information until responders have arrived at the scene. The Emergency Communications Center is also the after-hours answering point for most city services. The Communications Center is responsible for all the 911 phone and radio equipment used in Dubuque County. Service is provided 24 hours a day, 7 days a week. The Emergency Communications Department consists of the following staff: 1 Emergency Communications Manager, 3 Lead Dispatchers, 9 Public Safety Dispatchers, and 6 part-time Public Safety Dispatchers.
of 1985 the City of Dubuque and Dubuque County consolidated all public safety communications within Dubuque County into a Joint Public Safety Answering and Dispatch Point (PSAP). The Emergency Communications Center is the answering point for all emergency and non emergency calls requesting ambulances, fire and law enforcement for the residents of and visitors to City of Dubuque and Dubuque County. The Communications Center will dispatch the proper units and provide appropriate care and information until responders have arrived at the scene. The Emergency Communications Center is also the afterhours answering point for most city services. The Communications Center is responsible for all the 911 phone and radio equipment used in Dubuque County. Service is provided 24 hours a day, 7 days a week. The Emergency Communications Department consists of the following staff: 1 Emergency Communications Manager, 3 Lead Dispatchers, 9 Public Safety Dispatchers, and 6 part-time Public Safety Dispatchers.
Multi Disciplinary Safety Team (MDST)
Dubuque is one of six communities in Iowa that supports a Multi Disciplinary Safety Team (MDST). The Dubuque MDST is made up of engineers, planners, law enforcement, transit, emergency responders. The primary focus of the Dubuque MDST is traffic safety. The Dubuque MDST uses multidisciplinary approaches to help address local safety concerns as they arise. Their efforts include: traffic conditions, transportation planning, event traffic, public emergencies, school traffic, business traffic, parking patterns, traffic management, incident management, and construction planning.
Parks
Dubuque County
The Dubuque County Conservation Board manages approximately 2,300 acres in eighteen sites throughout the County. The parks and nature preserves managed by the Conservation Board provide hunting, fishing, campgrounds, biking and hiking trails, nature preserves, picnic areas, and boat ramps. The Swiss Valley Nature Center is the primary facility for the Conservation Board's environmental education programs. Conservation staff provide hands on learning to over 13,000 students and members of the public at Swiss Valley each year. The Conservation Board also maintains several recreational trails including the Heritage Trail, a twenty-six mile trail that runs between Dubuque and Dyersville.
City of Dubuque
The Park Division and Recreation Division of the Leisure Services Department manage the City of Dubuque's recreational facilities. These divisions provide services to the entire community through diverse recreational programs for all ages and an integrated, efficient, and safe system of parks, trails, and recreational facilities. The department also plans, develops, and maintains the formal public landscaping and natural areas in and around the City, demonstrating an appreciation for the environment. Park Division staff grow 70,000 annual flowers in a greenhouse and plant them in the park system and on city property. The Division also maintains the landscaping on US 20, and at the Port of Dubuque, gateways to the downtown area, and other locations within the City. The Recreation Division staff offers a variety of recreational programs for people of all ages. Program areas include adult athletics, recreation classes, summer playground program, programs for low and moderate income families, and aquatic programs. Recreation staff also operate the 18-hole Bunker Hill golf course and two public swimming pools: Flora Pool and Sutton Pool.
The City of Dubuque Park Division staff maintains:
- 47 parks with 878 acres
- 25 park shelters
- 19 tennis courts
- 18 restrooms
- Four accessible fishing piers
- Two skate parks
- 262 units of play equipment
- Disc golf course
- In-line hockey rink
- Eight softball fields, one baseball field
- 4600 street trees
- 18 miles of trails
- 1000 picnic tables
State of Iowa
The Mines of Spain State Recreation Area and E.B. Lyons Interpretive Center are located on 1,380 acres of wooded and prairie land just south of the City of Dubuque. The area has been designated as a National Historic Landmark and includes Julien Dubuque's Monument at a point just above where Catfish Creek meets the Mississippi. One of Iowa’s
“Watchable Wildlife Areas,” it features the E.B. Lyons Interpretive Center which serves as the visitor center and the park office. Park attractions include the Horseshoe Bluff Interpretive Trail, a 15 acre wetland, creeks, forest, prairies, cropland, meadows and views of the Mississippi River. The Mines of Spain State Recreation Area was dedicated in 1981. It was acquired with the assistance of the Iowa Natural Heritage Foundation.
City of Asbury - The City of Asbury maintains three parks and a pedestrian trail. Maple Hills Park is located at the end of Burr Oak Drive and has a softball diamond, tot lot and picnic tables. Asbury Park is located on Asbury Road by Springreen Drive. Asbury Park has a baseball diamond, basketball court, two tennis courts, and two hard surface volleyball courts, all of which are lighted. Asbury Park also has swings, slides, tot toys, picnic tables, grills, restrooms, a sand volleyball court and shelters. Information on reserving a shelter can be obtained by calling the city clerk’s office at City Hall. Althaus Wetland and Nature Preserve is located off Wintergreen Drive. The citywide trail system connects from Althaus Wetland to Maple Hills Park. The City is developing a new park between Park Place and Summer Drive. The City also operates the 18-hole Meadows Golf Club.
City of Farley - The City of Farley maintains two city parks. Westside Park, a small park on the city’s west side includes a shelter, swings, slides, and monkeybars. Farley City Park is home to four ball diamonds, several pavilions, swings, monkeybars, a merry-go-round, horseshoe pits, and tennis, volleyball and basketball courts.
City of Dyersville - Dyersville offers a wonderful selection of recreational areas and programs, which rivals park systems at communities many times its size. With 100 acres of land, the Park and Recreation Department oversees the city’s parks, shelters, skateboard park, baseball, softball and soccer fields, basketball courts, sand volleyball courts, concession stand, the Aquatics Center and a variety of recreational programs.
City of Peosta - Peosta has two parks. The Peosta City Park is located at 8579 Tennis Lane and is open from 6 a.m. through 11 p.m. daily. Amenities include a pavilion, playground equipment and a tennis court. The Peosta Community Centre located at 7896 Burds Road offers a variety of adult and children's fitness and recreational activities including basketball, volleyball, racquetball and tennis courts, indoor walking track, batting cage, cardio and weight training equipment, fitness classes, and other various programs. There is also a banquet room that can seat up to 620 guests and meeting room space available for smaller gatherings. A.J. Spiegel Park is located behind the Peosta Community Centre. The baseball complex consists of a semi-pro baseball diamond and two Little League/softball fields. The baseball diamond is the home field for Clarke University of Dubuque, the Peosta Cubs Semi-Pro team, and the Peosta Babe Ruth team.
City of Epworth - The City of Epworth operates two parks. Centennial Ballpark is a softball and baseball complex that offers league and tournament events. Tower Park, located near the center of town, offers a playground and a picnic facility with pavilion and grills. The park also offers public tennis courts for open play of tennis and basketball 8 a.m. to 8 p.m. The City also maintains the Jacoby Walkway, a one-mile walking trail along Jacoby Drive at the south city limits. The City plans to extend the trail to the east and to the north to connect with the city sidewalk system.
City of Cascade - The City of Cascade has three community parks. The Community Park is the largest park at just over 8 acres. It offers a large playground, a baseball/softball diamond, concession stand, two tennis courts, a basketball court, two sand volleyball courts, several pavilions, restrooms, and large parking lot. The Swimming Pool Park contains the Cascade Municipal Swimming Pool. The pool offers a concession stand, a small water slide, and diving boards. The park also has a small play area with playground equipment. The Riverview Park offers a great view and access to the North Fork Maquoketa River and the river falls. The park is a little over an acre in size and offers a pavilion, restrooms, small child playground, and a river landing.
Community Facilities
Goals and Objectives
The following goals and objectives are intended to guide the communities of Dubuque County in providing high quality community facilities to all residents of the County by maintaining the existing intergovernmental and public-private facilities relationships, and looking for areas to establish new relationships. The goals and objectives included in this section address the following facilities: parks and other recreational facilities, educational facilities, health care facilities, childcare facilities, law enforcement, fire and EMS services, and libraries.
- To encourage the majority of future development to locate within existing cities, or adjacent to existing cities in urban fringe areas planned for annexation, where adequate public services are planned or can be provided.
- Initiate a County-led process with local governments to establish mutual fringe area planning and development agreements that include the planning for and placement of community facilities, and provide minimum development standards to reduce unplanned impacts on community services, infrastructure, and neighborhoods.
- Encourage community facilities to locate within existing cities and established urban fringe areas where adequate public services are planned or can be provided.
- Locate community facilities that provide public services that serve the local community in rural areas only if compatible with adjacent uses, and located along a road that is adequate to support projected traffic demand.
- Allow new community facilities to be sited and existing facilities to be maintained, expanded and/or redeveloped in unincorporated areas only when there is access to paved roads, adequate water and wastewater facilities (including provision of water for fire suppression), and adequate buffering from existing residential development.
- Locate future community services outside of flood hazard areas where feasible, and discourage new development within the floodplain; where development is allowed in the flood plain, require it to be elevated, floodproofed and located outside the floodway.
- Continue to improve cooperation and coordination between township and city fire departments, and the County, to maintain adequate fire protection and water supplies for fire suppression.
- Discourage non-farm uses from locating outside of urban areas, or limit such uses to areas that are appropriate for the development and least disruptive of the natural character, and which are designed to blend with the natural character as much as possible, in order to preserve the natural character of the land or community.
- Build community facilities to retain natural drainage patterns, and construct post construction best management practices (BMPs) to help ensure development activity will not add substantially to the flood problem.
- Require new development in the unincorporated area of the County to reduce site runoff, both during and after construction, through the use of storm water management, detention basins, and buffer strips and other BMPs in order to protect the water quality of streams and rivers.
- To consider the use of sustainable design principles in community facilities.
- Consider the use of Universal Design principles to ensure accessibility of new and existing community facilities.
- Consider the use of Green Building Codes to reduce energy consumption and promote energy efficiency in new and existing community facilities.
- To provide public facilities and services at levels which support a desirable “quality of life” for current and future residents.
Community Facilities
- Provide facilities and services in locations compatible with planned uses, populations, and needs.
- Encourage new development to over-size facilities to serve adjacent development when the adjacent development is expected to require service.
- Promote coordination and cooperation among all law enforcement agencies.
- Coordinate the design, location and construction of stand-pipes and fire hydrants with fire districts as needed to protect new development in rural areas.
- Investigate the best method to receive preliminary rezoning and subdivision review comments from the County’s Fire Districts to address concerns of adequate roadway design, water supply, and water pressure.
- Support the provision of responsive, high-quality emergency medical services.
- Provide comprehensive investigation of criminal offenses.
- Continue to serve the public with compassion, competence, and open-mindedness.
- Continue to maintain mandatory certifications as required by state law and accreditation standards.
- Review and update standard operating guidelines on a regular basis.
- Continue to expand the use of state-of-the-art technologies.
- Encourage public safety departments to consider sustainable design principles when renovating existing and constructing new facilities.
- Prevent and control conduct that has been recognized as threatening to life, property, or public order by responding to reports of emergencies, identifying criminal activity or hazardous conditions, and taking appropriate action.
- Support comprehensive investigation of criminal offenses, apprehension of offenders, recovery of stolen property, and deterrence of criminal activities.
- Promote activities that foster positive relationships between youth and public safety personnel.
- Maintain partnerships with schools and community based organizations.
- Use community oriented policing to address the causes of crime and encourage long-term, innovative problem solving and improved law enforcement-community partnerships.
- Implement special initiatives in neighborhoods with higher incidences of crime.
- Support programs that promote safe behaviors, e.g. seatbelt enforcement, transportation safety education.
- Review and update existing intergovernmental agreements.
- Evaluate and promote new intergovernmental agreements.
- Improve interdepartmental emergency communications through interoperable communications technologies.
11. To protect life and property from fire.
- Study fire department response times and deployment, to help determine future needs.
- Continue to conduct inspections and enforce fire codes.
- Provide emergency first responder and advanced life support medical care throughout the county.
12. To monitor fire and emergency medical service (EMS) equipment, facilities, and procedures to ensure that adequate service is provided.
- Review and update standard operating guidelines on a regular basis.
- Continue to expand the use of state-of-the-art technology.
- Encourage fire and EMS departments to consider sustainable design principles when renovating existing and constructing new facilities.
13. To minimize the impacts of manmade and natural disasters.
- Encourage collaboration of the Dubuque County Firefighters Association and Law Enforcement agencies to review and update the County Incident Management Manual and the Dubuque County Disaster and Hazard Mitigation Plan on a regular basis.
- Continue to develop and maintain comprehensive emergency management planning for local governments which include severe weather, major mass casualties, hazardous material incidents, terrorism and weapons of mass destruction.
- Support a high level of disaster preparedness, to meet or exceed state and federal requirements.
- Develop mitigation programs and activities which will lessen possible catastrophic results from possible disaster occurrences.
- Promote appropriate disaster response training and equipment for public safety agencies.
14. To provide staff with current training and certifications.
- Encourage collaboration of the Dubuque County Firefighters Association and Law Enforcement agencies on the operation of the Regional Training Center.
- Encourage fire departments to work with the local Emergency Management Office to develop and review plans, exercises, and training.
15. To promote community education and outreach on fire safety.
- Educate all members of the community on fire safety.
- Educate homeowners on fire safety and proper smoke detector installation and use.
- Continue to work with the community to ensure fire code compliance.
16. To maintain quality health care facilities and services.
- Reduce and prevent the occurrence of disease, and disability in the community.
- Promote the physical and mental health, safety, and wellness of the citizens of Dubuque through educational and outreach efforts.
- Promote access to adequate health services for all members of the community through a collaborative effort of federal, state, local, private and charitable agencies.
- Address the special health needs of pregnant women, children, and the elderly.
- Create safe and sanitary work, play, and housing environments.
- Strive to contain the rising costs of health care in an equitable, efficient, and collaborative manner through community-wide planning.
- Retain and recruit quality health and medical personnel for our community.
- Continue to serve as a regional health care center providing a full-range of both general and specialty health and medical services.
- Work with the Dubuque County Board of Health to achieve the goals included in the County Health Needs Assessment and Health Improvement Plan.
17. To promote healthy behaviors throughout the population.
- Encourage programs that reduce obesity.
- Promote reductions in "high risk behaviors," e.g. tobacco use, alcohol abuse, and drug use.
- Promote access to medical, dental, and mental health care for all.
- Promote prevention and screening for chronic diseases.
18. To prevent injuries.
- Reduce injuries resulting from alcohol and substance abuse related accidents.
- Encourage violence reduction programs.
- Create safe and sanitary work, play, and housing environments.
- Increase the number of employers and organizations offering safety, wellness promotion, substance abuse and employee assistance programs.
19. To protect against environmental hazards.
- Develop programs to improve air and water quality.
Community Facilities
- Promote a safe and healthy environment by ensuring sanitary conditions and practices are in accordance with public health, housing and environmental ordinances, codes, and regulations.
- Promote safe and sanitary housing conditions through the reduction of radon, lead hazards, carbon monoxide poisoning, and other environmental health concerns.
20. To prevent epidemics and the spread of disease.
- Evaluate and improve communications between health care providers, facilities, and Dubuque County Public Health.
- Investigate the feasibility of a Dubuque County Laboratory that would increase the availability of testing.
- Provide education on ways to reduce the spread of disease.
21. To prepare for, respond to, and recover from public health emergencies.
- Foster collaboration of local governments and health care providers to create emergency preparedness plans and participate in emergency preparedness training.
22. To strengthen the public health infrastructure.
- Improve transportation system to enable Dubuque County residents to travel to health related appointments.
- Ensure all residents of Dubuque County have access to primary care physicians.
23. To support access to good quality, affordable dependent care.
- Support increased supply and range of available, high quality, affordable childcare, especially for low and moderate income households and those families with special needs children.
- Support increased opportunities for the elderly to maintain an independent lifestyle.
- Support the continuation and expansion of
family services and foster care.
24. To maintain high quality school systems.
- Coordinate with appropriate school districts to ensure that proposed developments can be adequately served by existing schools and student transportation systems.
- Encourage providers of education services to provide adequate educational facilities and improve educational opportunities for all age groups.
- Encourage public/private partnerships with local, regional, state, and federal agencies to improve existing facilities and programs and to plan and promote future education facilities and programs.
25. To support opportunities for life-long learning for residents of all ages.
- Support efforts to increase adult literacy.
- Promote access to all levels of education for all persons.
- Support individuals of all ages in pursuit of a sustained program of learning independent of any educational provider.
- Encourage public and private employers to offer continuing education incentives.
26. To provide access to timely, accurate, and useful information through reading, audio-visual, and electronic materials and programming through public libraries.
- Support coordination and sharing of resources to better serve the needs of the public.
- Promote featuring current, high-demand, high-interest materials in a variety of formats for persons of all ages and abilities at public libraries throughout the region.
- Promote use and awareness of the quality of the public libraries.
- Support expansion and accessibility of library services throughout the community.
- Foster a learning environment that utilizes state-of-the-art technologies.
27. To create and deliver a quality education that allows all students to reach their highest potential.
- Promote a variety of assessment tools, methods, and strategies to evaluate and/or document student progress, in accord with national and state standards.
- Champion superior standards of academic excellence, in which values are integrated in the lives and work of all members of the school community.
- Support a comprehensive educational program that provides services to students ranging from severely and profoundly disabled programs through gifted programs and advanced placement courses.
- Strive to prepare students for careers, lifelong learning, and citizenship in contemporary international society.
- Encourage activities that promote lifelong physical fitness and health awareness.
- Provide services that allow high school students to pursue either college or vocational education.
- Promote high school completion and encourage postsecondary education or vocational training.
- Provide adequate and nutritional food service before and during school.
28. To encourage school districts to consider smart planning and sustainable design principles when developing school facilities plans.
- Encourage school districts to consider sustainable design principles when renovating existing and constructing new facilities.
- Encourage school districts to consider neighborhood impacts when considering closures of existing school facilities and locations for new school facilities.
- Foster collaboration of school districts and transit providers to explore clean, safe, efficient, and cost-effective student transportation.
29. To provide opportunities for residents to enjoy outdoor recreational activities.
- Provide an integrated system of public parks, trails, and related open space areas that will provide County residents with adequate opportunity to participate in a wide range of outdoor recreational activities.
- Support parks, green space, trails, and similar park/open space uses easily accessible to residents at neighborhood level.
- Encourage and consider development of incentives for providing common open/green space, hike/bike trails, and landscaping in all new development wherever possible.
30. To provide a safe park and recreation system that continues to meet the region's needs for useable and accessible parkland and open space.
- Encourage coordination between the County and communities to improve the existing high quality, safe, park and recreation system.
- Encourage coordination between the County and communities to identify the type of parks, park facilities, and hike/bike trails lacking in the community.
- Continue to identify potential park and recreation sites and hike/bike trails to meet the needs identified in the Dubuque County Comprehensive Plan.
- Continue to identify funding sources and partnerships for land acquisition and development of interconnected recreational open space and parkland.
31. To provide a variety of affordable and accessible recreation classes and activities for people of all ages.
- Continue to identify the needs and interests of people of all ages and the types of programs they desire/need.
- Support maintenance of an inventory of organizations and groups identifying what programs they are offering in the region.
- Support a varied public program offering activities and programs not being provided by other organizations and groups.
- Assess the facility needs of the region so as to meet the recreational needs of the region.
32. To enhance the visual attractiveness of the community and park system.
- Support maintaining and enhancing all park areas in a manner that fosters pride in the park system.
- Consider providing flowers and other landscaping accents to enhance the beauty of all park areas and County-owned property, including use of indigenous plants, where possible.
- Support continuing improvement programs for park equipment, pavilions, and rest rooms.
- Encourage property owners to plant more trees.
- Encourage local residents to participate in community beautification through community clean-up events, gardening clubs, and other volunteer opportunities.
33. To provide interconnected recreation facilities for residents throughout the region.
- Continue to promote and maintain existing parks and public open spaces.
- Implement the Tri-State Integrated Biking, Hiking, and Walking Plan, including recommendations for a regional trail system connecting area parks, community facilities, and other locales to the Dubuque County Heritage Trail and the Mississippi River Trail.
Map 4.1 - City of Asbury Community Facilities
Map 4.2 - City of Cascade Community Facilities
Community Facilities
Map 4.3 - City of Dubuque Community Facilities
Map 4.4 - City of Dyersville Community Facilities
Map 4.5 - City of Epworth Community Facilities
Map 4.6 - City of Farley Community Facilities
Map 4.7 - City of Peosta Community Facilities
Community Facilities
- Cemetery
- City Hall
- Fire Department
- Police Department
- College/University
- Elementary School
- Park
City of Peosta
Community Facilities
Data: Dubuque County, 2012
Map Created By ECIA, 2012
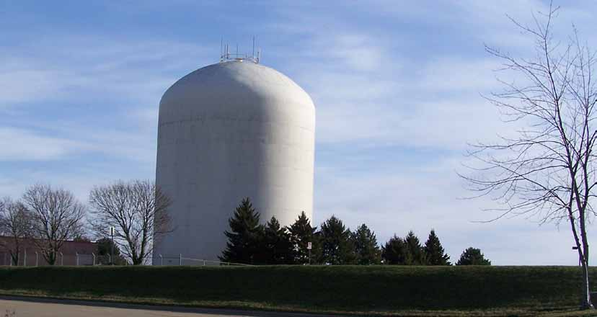
Chapter 5
Public infrastructure and utilities are a key component of quality of life within the Dubuque County Region. Access to infrastructure and utilities also has a profound impact on land development. Land that has access to municipal utilities has greater development potential and has a higher value than land that does not have access. In rural areas where no municipal utilities are available, residents rely on private wells and septic systems. These systems are effective, but require large lots to avoid groundwater contamination. This chapter will provide an introduction to the County's public infrastructure and utilities and explore how these necessary items impact land use, environmental quality, and economic development.
Water Supply and Distribution System
A typical water supply and distribution system will contain four basic components: a Water Source, Filtration and Treatment, Water Pressure and Storage Tank, and Local Distribution Pipes. Figure 5.1 shows a basic water supply and distribution system. Water filtration eliminates any undesirable biological contaminants and provides water with a desirable chemical balance. The treated water is pumped from the treatment source to a water storage tank. The purpose of the tank, which is usually in the form of
Figure 5.1 - Schematic Diagram of a Typical Water Distribution System
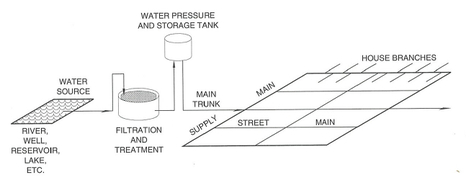
Source: Anderson, Larz T. Planning the Built Environment, 2000
an elevated water tower or reservoir, is to provide pressure to push water throughout the system. After water leaves the storage tank, a system of underground pipes delivers the water to homes and businesses. In low density rural areas private wells are used to supply water.
Community Water Distribution Systems
Asbury - The Asbury municipal water supply currently has three active public water wells open in the Cambrian-Ordovician aquifer. The approximate discharge for all wells is 11,552,000 gallons per day (gpd). The Colonial Estates well is capable of producing 425 gallons per minute (gpm), the Woodmoor well is capable of producing 180 gpm, and the Wedgewood Estates well is capable of producing 225 gpm. Municipal water is delivered via a network of 165,000 linear feet of piping ranging from four to twelve inches in diameter.
Cascade - Cascade's water supply comes from two wells: one well drilled to a depth of 244' in a Silurian aquifer formation; the other is drilled to a depth of 950' deep in a sandstone formation. The City of Cascade has approximately 1,025 water system customers. Average daily demand is 196,300 gallons. Current elevated water capacity is 140,000 gallons. Cascade's two wells have combined pumping capacity of 785 gallons per minute. Cascade's water distribution system has some 19 miles of underground water main, approximately 45% of which is 4" diameter, 15% is 6" diameter, 40% is 8" in diameter, with the remaining 5% being 10" diameter or greater. Cascade serves 1,025 customers with its water system. The City is preparing to upgrade the system in 2012-13 with a new well, additional mains looping the system, and a new 400,000 gallon composite elevated storage tank.
Dubuque - Water is pumped from five shallow and four deep wells. Deep wells yield high quality water, but the shallow wells are used as the primary source since they are more energy efficient. Well depths vary from 127' to 200'. Individual well capacities range from 1.55 to 3.30 million gallons per day (MGD) and the theoretical combined capacity of all five wells at 14.15 MGD. Water pumped from the wells is aerated, treated with lime, and filtered. Following filtration, the water is disinfected with chlorine and fluoride and phosphate is added. After the water is treated, it is pumped into the distribution system. Dubuque must maintain five separate distribution systems because of its hills and elevation variations. The distribution system includes five tanks and two reservoirs with a total storage capacity of 18,050,000 gallons. Water is then forced through 318 miles of piping ranging in size from four inches up to twenty-four inches in diameter.
Dyersville - The City of Dyersville is served by two water wells at which the groundwater is drawn from the Cambrian Jordan Sandstone aquifer. The first water well, along with its booster stations, is located in the northwest portion of the City and it is near a 750,000 gallon reservoir. The second water well is located in the southeast portion of the City and it is located near a 500,000 gallon water tower.
Epworth - Epworth has three wells that produce a total of 907,200 gallons per day. Well number three has a nitrate removal system. The city has one water tower with a 300,000 gallon capacity.
Farley - Farley operates three wells. Well one has the capacity to pump 150 gallons per minute and wells two and three can pump 300 gallons per minute. Once water is pumped from the ground, the water is treated with phosphates and chlorine gas. The city has two water towers with a combined storage capacity of 450,000 gallons.
Peosta - Peosta has two wells, both with 280 gallon per minute capacity. Peosta treats water by adding chlorine and polyphosphate. The community has two water towers with a combined capacity of 350,000 gallons. The existing facility has been designed to serve the projected 2032 population of 2,536 persons. Possible future expansion plans include extension of service to Centralia and new subdivision development.
Wastewater Collection and Treatment Systems
There are two basic methods used for treating wastewater. The preferred method for urban and residential areas is to collect wastewater through a network of pipes and let it flow by gravity to a treatment plant. The treatment plant separates solids (sludge) and liquids (effluent). The sludge is disposed of in a way that is economical and safe for the environment,
Figure 5.2 - Schematic Diagram of a Wastewater Collection and Treatment System
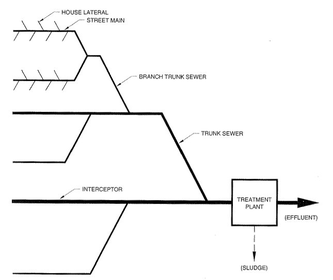
Source: Anderson, Larz T. Planning the Built Environment, 2000
and the effluent is usually discharged into a flowing stream or rivers. Figure 5.2 shows a schematic diagram of a wastewater collection and treatment system and water treatment plant.
In rural areas, septic tanks are used to treat sewage. Wastewater flows by gravity from an individual source into a septic tank where it is biologically digested by a natural process. The system allows the effluent to flow through a leaching field into the nearby soil. The sludge is removed from the tank every two or three years. Septic tanks are used primarily in low density rural areas. Separation between the well and septic tank are required to prevent drinking water contamination.
Community Wastewater Systems
Asbury – The existing wastewater collection system is in good condition. Gravity collection lines ranging in diameter from 4-inch to 16-inch and force mains ranging from 4 inches to 10 inches serve the City. In addition to gravity collection lines and force main, the City is also served by eight lift stations (Hales Mill, Radford Road, Wedgewood, Arrowhead, Northwest, Brook Haven, Asbury Court Place, Carver).
The mechanical wastewater facility opened in 2007 and includes a headworks building that houses grit removal, screenings removal, laboratory, and control room. The process uses an oxidation ditch, final clarifiers, RAS/WAS pumping systems, sludge storage, flow equalization basins, and a UV disinfection system to achieve compliance with the City's National Pollutant Discharge Elimination System (NPDES) permit requirements. The existing facility has been designed to serve the projected 2023 population of 6,121 persons. Asbury's wastewater collection consists of 151,000 linear feet of piping ranging from two to fifteen inches in diameter.
Cascade – Cascade's wastewater treatment system plant currently treats an average of 168,000 gallons of effluent per day for 1,010 customers. The plant has capacity to treat 250,000 gallons of sewage per day.
Dubuque – Dubuque's wastewater treatment plant has the capacity to serve a population of 204,000. This capacity should meet the city's projected population needs for approximately thirty years. The city operates fourteen pumping stations, all with standby capability.
Dyersville – The City of Dyersville constructed a wastewater treatment facility in 2001 to carry water, other liquids and waterborne refuse carried by sanitary sewer distribution systems. In 2009, a second phase of the wastewater treatment facility was constructed consisting of: aerobic digester aeration system replacement, sludge processing building, abandoned lagoon cell conversion to long-term sludge storage, installation of an effluent recycle lift station and pressure system, and installation of variable frequency drives on the oxidation ditch mechanical aerators along with an automatic level control system.
Epworth – Epworth's wastewater treatment system consists of a 3-cell aerated lagoon with three lift stations. A new wastewater aero-mod mechanical plant is in the design phase.
Figure 5.3 - Residential Garbage and Recycling Collection Service Providers
| City | Garbage Collection | Recycling Collection |
|---|---|---|
| Asbury | Dittmer Recycling | Dittmer Recycling |
| Cascade | City of Cascade | Allied Waste |
| Dubuque | City of Dubuque | City of Dubuque |
| Dyersville | Bi-County Disposal | Bi-County Disposal |
| Epworth | Roling Sanitation | Roling Sanitation |
| Farley | Dittmer Recycling | Dittmer Recycling |
| Peosta | Bi-County Disposal Inc. | Bi-County Disposal Inc. |
Farley – Farley's wastewater treatment system consists of an activated sludge mechanical plant and two lift stations.
Peosta – Peosta's wastewater treatment system consists of aerated lagoons and 7 lift stations.
Solid Waste Disposal and Recycling
The Dubuque Metropolitan Area Solid Waste Agency (DMASWA) is an intergovernmental entity formed in 1973 under Chapter 28E of the Code of Iowa. Although originally formed primarily for the purpose of owning and operating a sanitary landfill, the DMASWA has since broadened its mission. Members of the DMASWA include the City of Dubuque, with two Board representatives, and Dubuque County, with one representative. All remaining municipalities in Dubuque and Delaware Counties have signed 'Non-Member Service Agreements'. The Agency's municipal solid waste (MSW) landfill is located on Dubuque's west side along U.S. Highway 20. Its service area is Dubuque and Delaware counties. The Agency owns 460 acres of property, of which 80 are permitted for landfill use.
Garbage and recycling collection in Dubuque County is provided by a variety of municipal and private service providers. Waste collection and disposal are regulated by state and local laws. Figure 5.3 lists Dubuque County garbage and recycling service providers. Recycling in Dubuque County is strongly encouraged.
Telecommunications
Telecommunications infrastructure is becoming an increasingly important issue for economic development and quality of life in the region. High-speed internet and mobile phone service have become a necessity for most residents and many businesses. Internet access has become so important that the United Nations declared it a basic human right in 2003. Expansion of internet use has increased demand for internet bandwidth and has required expansion of telecommunications infrastructure. Many people now rely on the internet for shopping, banking, entertainment, job applications, applying for government services, and much more. Figure 5.4 provides a list of telecommunications service providers currently operating in Dubuque County.
| Figure 5.4 - Dubuque County Telecommunications Service Providers | |
|---|---|
| Wireline Providers | Wireless Providers |
| Alpine Long Distance | AT&T Mobility |
| Bernard Telephone | Bernard Telephone |
| Cascade Communications Company | Dish Network Corporation |
| Centurylink | Hughes Network Systems |
| Lamotte Telephone Company | Speed Connect |
| Mediacom | Sprint |
| Windstream | Verizon Wireless |
| ViaSat | |
| U. S. Cellular | |
| You Squared | |
| Source: Connect Iowa |
Map 5.1 - Maximum Advertised Download Speed
Map 5.1 shows maximum advertised broadband speed for Dubuque County and the State of Iowa. According to the maps, higher download speeds are available in the urban areas where wireline broadband is available. Broadband internet is available in the rural areas of the county through wireless providers, but download speeds are slower with wireless service. Data transfer rates are measured in megabits per second (mbps).
Download speeds in Dubuque County are similar to those seen across the state. In the urban areas in Dubuque County, download speeds of between 25–50 mbps are available. This is comparable to most urban areas across the state, but in some areas, download speeds greater than 100 mbps are available. In most instances, the maximum advertised speeds are much higher than an average internet user would require. According to Connect Iowa, the average residential download speed in Iowa is 5.2 mbps and the average business download speed is 7.2 mbps. Higher speeds are important for businesses and institutions that need to send large quantities of data quickly.
The data presented in Map 5.1 indicates that broadband is available almost everywhere in the county, but availability does not equal accessibility. According to Connect Iowa survey data, 34% of Iowa residents do not have broadband access. When asked why they did not subscribe to broadband the top three responses were: no content worth viewing, 26%; Broadband fees too expensive, 23%; and computer too expensive, 7%.
Map 5.1 - Maximum Advertised Download Speed
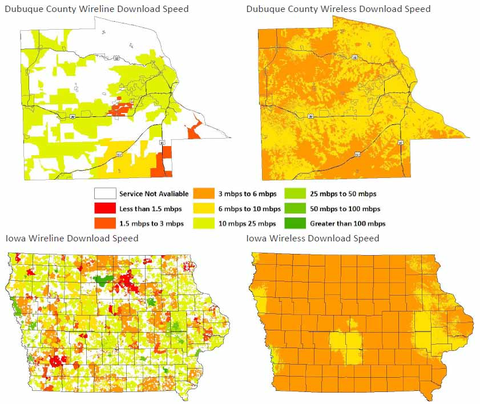
Source: Connect Iowa, 2012
*Data transfer rates are measured in megabits per second (mbps).
Power Plants and Transmission Lines
Interstate Power and Light Company (Alliant Energy). Alliant Energy provides electricity to 1.4 million customers in Iowa, Illinois, and Wisconsin. Alliant Energy's corporate offices are located in Madison, Wisconsin. The company also has general offices in Cedar Rapids and Dubuque. Alliant Energy primarily serves the urban areas of the county, but it does serve some rural areas as well.
Maquoketa Valley Electric Cooperative (MVEC) is a private, non-profit electric utility that was established in 1935. MVEC is member owned and provides electric service to primarily rural areas of Delaware, Dubuque, Jackson, and Jones Counties. MVEC serves 14,000 members across 3,100 miles of line.
Cascade Municipal Utilities is a city-owned provider of electricity (and natural gas) service to 1,098 customers (2011) within its corporate limits. Cascade Municipal Utilities supplies electricity to its customers primarily from long-term wholesale energy contracts with other providers, but also has stand-alone generation that can supply all power during service outages or during peak-load periods.
Map 5.2 - Iowa Utilities Board Electrical Service Areas
Public Infrastructure and Utilities
ITC Midwest, a subsidiary of ITC Holdings Corp, operates the electrical transmission lines that run through Dubuque County. ITC Midwest operates more than 6,800 circuit miles of transmission lines in Iowa, Minnesota, Illinois and Missouri. The company is headquartered in Cedar Rapids, Iowa, and maintains operating locations at Dubuque, Iowa City and Perry, Iowa; and Albert Lea and Lakefield, Minnesota.
Map 5.2 shows the service areas for the three electrical service providers that operate within Dubuque County.
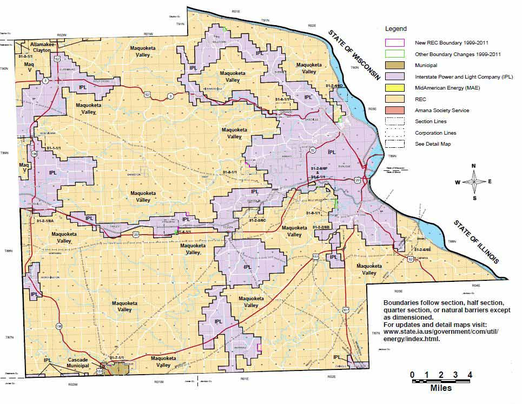
Infrastructure and Development
Public expenditures for infrastructure can shape a community’s land use patterns, and in turn, the community’s land use patterns will determine the costs and efficiency of utility service delivery. Communities can use smart planning principles such as higher density and infill development to keep utility rates low and improve delivery system efficiency. Adding new developments to the existing network spreads the systems’ capital costs over a larger customer base lowering the costs of service per customer. However, if new infrastructure is built for new customers, the opportunity to improve the efficiency of the existing system is lost, leading to higher costs per customer.
For example, large lot low density residential development patterns can lead to increases in water demand and cost. Large lots increase the length and thus the cost of the pipes serving households and commercial buildings. Buildings on smaller lots are typically closer to the water main running under the street and require a shorter branch pipe to get the water from the main to the building. Higher density neighborhoods also have more houses per block of main, so the cost of the main will be less per house than in neighborhoods with larger lots. Large lots can also increase demand for water because of larger yards. Low density systems can lead to increased water loss because of leaks, as longer pipes require more pressure to push the water through the system.
Rural Development
Since the 1990 census, the population of Dubuque County has been steadily expanding. As of the 2010 census, the County had regained nearly all of the 7,342 people it had lost between 1980 and 1990. However, the population did not return to the same areas of the County. Between 1990 and 2010, the County’s population began to decentralize, relocating from the City of Dubuque to the smaller cities and the unincorporated rural areas of the county. The pace of the decentralization has accelerated within the last ten years. Map 5.3 - Building Starts 2000-2010. The map shows large amounts of new construction in the smaller cities and in the urban fringe area on the west side of Dubuque and the surrounding unincorporated areas.
The spatial population shift of the past 20 years has resulted in expansion of public and private infrastructure within the county. This growth pattern conflicts with the smart planning principles listed above and conflicts with previously adopted goals and objectives. This conflict was identified in the 1969 County Land use Plan and was noted in the 2002 Dubuque County Comprehensive Land Use Development Plan. The following is an excerpt from a section of the 2002 County Plan entitled “Review of Conflicting Land Use Goals and Objectives:”
“Dubuque County’s 1969 Land Use Plan addresses, under Principal Objectives pages 24 and 25, how im-”
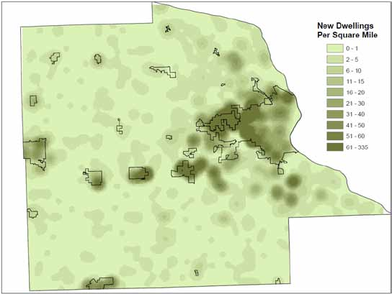
Source: Dubuque County Assessor and City of Dubuque Assessor
important the existing community centers are as a focus for urban growth, the importance of the services they provide, and the organized community structure which provides a means for the development of local plans and policies to control the nature and pattern of new development.”
The 2002 Plan then goes in a different direction and addresses the Greater Dubuque Area Unincorporated Fringe, and the projected major population growth that is expected to occur in this fringe area and how new (unincorporated) communities will develop here and (hopefully) be able to (financially) support basic community services, or else connect with the City of Dubuque's utilities by major trunk lines. It goes on to say that in more remote locations, individual sewage treatment and water plants may be required. The Plan does say that these (unincorporated) communities may be formed as a result of intelligent planning and by cooperative action of county and city government, if they are not an extension of an existing urban center. This idea appears to open the door to a potentially great deal of unincorporated development without providing much direction or detail on how the “cooperative action between county and city” should occur, or when. This idea appears to be the only significant policy conflict in the County’s 1969 Land Use Plan, and it flies in the face of orderly incorporated community growth.1
The 2002 County Land Use Plan attempted to address these conflicting goals. Controlling urban sprawl, encouraging growth in or near cities, and preserving rural farm character were all listed as key issues in the 2002 Plan, but as noted in Map 5.3, rural development has continued to expand since the plan was adopted.
Return on Investment
Effective land use and utility planning are especially important during uncertain economic times. During hard economic times, communities need to “do more with less.” In other words, the community needs to get more out of the investments it makes, or improve its return on investment. Communities invest in many things, but utility infrastructure is one of the largest and most important investments a community will make. Communities invest in the installation and maintenance of infrastructure to stimulate private sector investment and development, which creates value in the local economy. The value created is taxed and the tax revenue is used in part to pay for the maintenance of the infrastructure. If a community wants to get more value out of its infrastructure, it should consider investing in the most productive types of development. How can a community measure the productivity of its infrastructure investments? The City and County Assessor's place a value on all property in the county for tax purposes. The assessors’ tax records will provide a consistent measure of value for all properties in the county.
The following is a productivity comparison of two Dubuque County properties based on assessor’s tax records. Figure 5.5 shows the two properties. Both are commercial properties located in the city of
| Figure 5.5 - Total Annual Property Tax | ||
|---|---|---|
| Property 1 | Property 2 | |
| Property Tax | $3,369 | $622,494 |
Source: Dubuque City Assessor, www.beacon.com/dubuquecounty
Dubuque and both pay the same property tax rate. Property 1 is a three-story commercial building located in an urban area with retail on the bottom floor and apartments on the top two floors. Property 2 is a large factory located in an industrial area. Figure 5.5 also includes the annual property 2011 property tax owed on each property.
Based on total property tax, Property 2 is clearly the more valuable property. However, total property tax is not the best way to measure the property's productivity and the return on the community’s infrastructure investment. Figure 5.6 uses an example to explain why total tax is not a good measure of productivity. A community’s return on investment is somewhat analogous to a family shopping for a
car. Fuel consumption is the most important feature for the family and they have narrowed their choices down to a car and an SUV. If we used the same approach as above, the family would want to look at the miles per tank. However, miles per tank would be an inaccurate measure of productivity because we know that the two vehicles have different fuel tank sizes. The best way to compare fuel productivity is to look at the fuel economy of the vehicle. Using the fuel economy measure, we find that the car provides more miles of travel per gallon of gas.
| Figure 5.6 - Fuel Economy | ||
|---|---|---|
| SUV | Car | |
| Miles Per Tank | 474 | 374 |
| Tank Size | 31 gal | 16 gal |
| Miles Per Gallon | 17 | 26 |
| Source: www.fueleconomy.gov |
We can apply the same logic to the two properties.
| Figure 5.7 - Property Tax Per Acre | ||
|---|---|---|
| Property 1 | Property 2 | |
| Property Tax | $3,369 | $622,494 |
| Acres | 0.05 | 27.08 |
| Tax Per Acre | $67,380 | $22,987 |
| Source: Dubuque City Assessor, www.beacon.com/dubuquecounty |
Property 2 produces much more tax revenue, but it takes up more land and requires more infrastructure than Property 1. As a result, tax per acre would be a more accurate measure for the productivity of these two buildings, as it accounts for differences in each property's size, just as the MPG calculation does for the family buying the car. The results from this example are displayed in Figure 5.7.
Using the tax per acre measurement, we find that Property 1 is almost 3 times more productive than Property 2. This example is not intended to diminish the factory's contributions to the local economy. Large industrial land uses contribute to the regional economy and employ thousands of Dubuque County residents. The example is intended to show that high density urban development can provide a high return on infrastructure investment. Investing in land uses that use infrastructure most efficiently by adopting smart planning principles can help communities keep property taxes and utility rates low. Many communities would spend great amounts of time and effort to attract one large factory to their town, but updating existing infrastructure and attracting several new businesses to their downtown may be a more practical and financially productive solution for economic development.
Goals and Objectives
- To provide, maintain, and improve safe, cost-effective, functional, and self-supporting public utility systems including water, sanitary sewer, storm sewer, communications, and solid waste disposal, with a focus on sustainable materials management where applicable.
- Support timely, cost effective delivery of services.
- Perform routine maintenance and testing to ensure optimum utility provision.
- Budget for short and long term system improvements.
- Support ongoing improvements to facilities.
- Support ongoing improvements to distribution systems.
- Support ongoing improvements to landfill diversion efforts.
- Comply with state, federal, and local environmental regulations.
- Support the adoption of new technologies that reduce costs, improve delivery of service, and reduce impacts on the environment.
- To plan for, build, and improve infrastructure systems to meet anticipated growth and development needs.
- Encourage development and redevelopment in areas where infrastructure is existing or underutilized in the cities.
- Support building future infrastructure at a higher capacity for future identified growth areas in cities.
- Support municipal utility rate structures that are both adequate to meet current obligations and future needs and are equitable for services received by residential, commercial, and industrial users.
- Investigate and implement technological advances to optimize service delivery.
- Plan for orderly replacement and upgrade of public and private communication infrastructure with attention to features, capacity, compatibility, and future growth.
- Consider opportunities for buried public and private communication infrastructure during planning for street, water, and sewer construction projects.
- Support providing sanitary sewer and water main extensions within cities in a timely manner, when economically feasible.
- Evaluate periodically the water system storage and hydraulics of cities to ensure ability to serve future growth demands.
- Support a "looped" water distribution system, where practical.
- Continue to encourage and enhance downtown development by striving to meet current parking needs and providing expansion programs that are cost-effective and innovative.
- Monitor and coordinate appropriate implementation of communication, gas and electric delivery systems.
- Encourage public investments in infrastructure that will result in private-sector investments that can financially sustain the maintenance of that infrastructure.
- Evaluate and ensure the design and location of stormwater inlets and outlets are strategically located, managing runoff as close to its source as possible, and minimizing the volume of stormwater runoff to avoid causing problems for downstream neighbors.
- To encourage the use of low impact development and centralized water or sewer systems to preserve open space and prevent degradation of the air and water quality throughout the region.
- Encourage the use of Low Impact Development (LID) principles in new development throughout the region.
- Encourage development to locate within ex-
Public Infrastructure and Utilities
isting cities and establish urban fringe areas where adequate public utilities are planned or can be provided.
- Encourage existing developments that have expanded beyond the original subdivision, to install centralized water and septic systems in the new development and the original development, if there has been a history of contamination problems in or adjacent to the original subdivision.
- Require new developments in the unincorporated area of the County to provide for the private long-term maintenance and operation of internal infrastructure.
- Require new developments in the unincorporated area of the county to be designed for future connection of municipal services.
- Provide financial assistance for new development to over-size facilities to serve adjacent development when the adjacent development is expected to require service.
- Facilitate the incorporation of new septic system technologies into the County's health regulations.
- Continue to implement the State's solid waste disposal hierarchy while developing new methods to minimize waste and divert resources to beneficial use through comprehensive deconstruction, reuse, recycling, composting, anaerobic digestion, methane capture/utilization, hazardous materials management, enforcement on illegal dumping and littering, and public education programs.
- Establish a system to continuously monitor the performance of stormwater best management practices (BMPs), and ensure proper maintenance is being performed as needed with each practice.
4. To provide public facilities and services at levels which support a desirable “quality of life” for current and future residents.
- Require new development to fund public water and wastewater systems required to meet the needs of the proposed development.
- Establish a system, for planning purposes, which will evaluate the costs and benefits of necessary rural services when provided to new rural growth.
- Provide facilities and services in locations compatible with planned uses, populations, and needs.
- Establish a system to continuously monitor individual well and septic systems for detection of potential off-site environmental contamination before it occurs.
- Evaluate the creation of rural water districts in developed areas experiencing water quality problems, and encourage non-farm residents to join rural water districts as soon as possible after district creation.
- Evaluate the creation of rural sanitary sewer districts in developed areas experiencing septic system problems, with the boundaries of such districts based, whenever possible, on existing watershed areas.
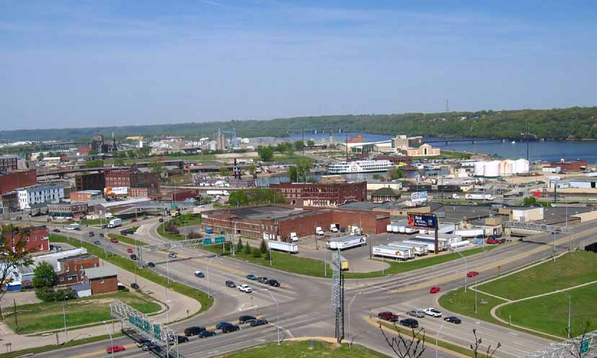
Chapter 6
Dubuque County’s transportation system is vital to everyday life within the region. Locally, the transportation system facilitates the movement of people and goods within the region. The system allows residents to get from their homes to employment, education, medical care, and shopping. The transportation system also allows people and goods to move in and out of the region. Businesses import products and raw materials from outside the region, and export goods and commodities to other regions. Connections to regional transportation networks allow businesses to conduct these transactions quickly and efficiently, and allow the region to compete in the global market place.
Along with the benefits from transportation, come unintended negative impacts. If left unchecked, pollution, noise, congestion, safety, and high maintenance costs can diminish quality of life for local residents. In addition, some segments of the population such as the disabled, the elderly, and low-income populations are not able to access the transportation system. Through the Comprehensive Plan, the Consortium will strive to provide efficient and affordable transportation to residents and businesses while striving to minimize the negative impacts. The Consortium will work to provide diverse and interconnected modes of transportation, accessibility, safety, and improved environmental quality.
Transportation Planning
Comprehensive Planning Consortium members coordinate with two regional transportation planning agencies, the Dubuque Metropolitan Area Transportation Study (DMATS) and Regional Planning Affiliation 8 (RPA 8). DMATS is a tri-state Metropolitan Planning Organization (MPO) that includes the cities of Dubuque, Asbury, Peosta, a portion of unincorporated Dubuque County, and portions of Jo Daviess County, Illinois, and Grant County, Wisconsin. The Regional Planning Affiliation (RPA 8) is a four-county region including the counties of Clinton, Delaware, Dubuque, and Jackson. Both agencies are responsible for approving goals and plans for the development of a seamless transportation system for the safe and efficient movement of people and goods within and among modes of transportation (roads, bicycle and pedestrian facilities, transit, rail, water and air) in the area. DMATS and RPA 8 encourage cooperation among local, regional, state, and federal agencies on transportation issues and plans.
The Dubuque County Comprehensive Plan provides an overview of the county's transportation system. More detailed transportation information can be found in the DMATS and RPA long range transportation plans (LRTP). A long range transportation plan focuses on transportation-related issues in a specific area over a 20-year period. Federal law requires that MPOs update their LRTPs every five years. The LRTP provides a view of the current transportation trends in the area, as well as an aid in projecting potential changes for the area into the future. Both plans are available for download at www.eciatrans.org.
Roadways
The predominant transportation system in Dubuque County is a network of streets and highways that are used by automobiles and trucks. These roadways serve the circulation needs of local residents, employers, and people traveling from outside the area. The following describes the roadway system in the county in terms of its functional classification, existing capacity, congestion, and safety.
Functional classification describes a roadway based on the type of service that it provides. Roadways provide two basic types of service: land access and mobility. The degree to which a roadway provides access and/or mobility determines its functional classification. The key to planning an efficient roadway system is finding the appropriate balance between mobility and accessibility. The following defines the functional classifications found in Dubuque County.
Principal Arterial roadways primarily serve a mobility function with minimal land access. The primary purpose of principal arterials is the rapid movement of people and goods for extended distances. Principal arterials are high capacity, high-speed roadways with restricted access. US 20 west of Swiss Valley Road in Dubuque County is an example of a principal arterial.
Minor Arterials interconnect with and augment principal arterials. Minor arterials within urban areas serve inter-community trips of moderate length. Although the primary purpose of the minor arterial is mobility, this functional class provides more access points and more land access than a principal arterial. John F. Kennedy Road in the City of Dubuque is a local example of a minor arterial.
Major Collector streets channel trips between the local street system and the arterials. Major collectors serve a balance between mobility and land access. Parking and direct driveway access to the street are typically allowed on major collectors. Collectors are usually wider, have higher capacity, and permit somewhat higher speeds than the local street network. Chaney Road in the City of Dubuque is designated as a collector street.
Minor Collectors & Local Streets primarily provide local land access and offer the lowest level of mobility. Characteristics of local streets include uncontrolled intersections, posted speed limits of 25 miles per hour or less, and few restrictions on parking. Local streets include all streets not classified as interstate, principal arterial, minor arterial, or collector.
Figure 6.1 lists the miles of roadway in Dubuque County in terms of functional classification. Maps 6.1 through 6.8 display the location of the primary roads in Dubuque County by functional classification.
Figure 6.1 - Miles of Roadway by Functional Classification
| Functional Classification | Total Roadway Miles |
|---|---|
| Principal Arterial | 121 |
| Minor Arterial | 71 |
| Major Collector | 174 |
| Minor Collector | 157 |
| Local Streets | 792 |
| Total | 1,314 |
Source: ECIA
Level of Service
Level of Service (LOS) is a qualitative measure describing conditions within a traffic stream, based on speed, travel time, freedom to maneuver, traffic interruptions, comfort, and convenience. LOS is determined by calculating the Volume to Capacity (VC) ratio, where the traffic volume, observed or forecasted, is divided by the estimated capacity of the roadway. LOS “A” represents complete free flow of traffic, allowing traffic to maneuver unimpeded. LOS “F” represents a complete breakdown in traffic flow, resulting in stop and go travel. VC ratios were calculated using 2009 Iowa DOT traffic counts. See Map 6.1 for the current level of service in Dubuque County.
Map 6.1 - Dubuque County Level of Service 2010Source: DMATS, 2012; Iowa DOT, 2012
Dubuque County Regional Comprehensive Plan
Future Needs
Map 6.2 shows the future level of service for roads in Dubuque County for the year 2040. Again, level of service was determined based on the ratio of volume to capacity of the road segment. Future traffic volumes were estimated using data from the DMATS travel demand model and the Iowa Department of Transportation’s statewide travel demand forecast model. The map presents a scenario of what would happen if traffic volumes continued to increase while the road network remained the same.
Based on the Iowa DOT’s forecast, if no changes are made to the transportation network, by the year 2040
Level of Service is calculated by dividing the observed traffic on a road segment by its capacity. Data Source: DMATS and Iowa DOT
several of Dubuque County's main thoroughfares, including Asbury Rd, NW Arterial, and US Hwy 20 will be severely congested. Congestion of this magnitude will negatively affect quality of life and the regional economy. To prevent this from happening, local governments will need to either increase the capacity of the road network, or reduce the number of vehicles on the road.
In the past, adding capacity has been the standard remedy to roadway congestion. Adding additional lanes to roads is an effective way to reduce congestion, however this can be very costly, and it may only be a short time before the newly expanded road is once again congested. In recent years, cities have turned to strategies that attempt to reduce the number of cars on the road. Encouraging a multi-modal transportation system that includes walking, biking, and mass transit is a method for removing vehicles from the road and reducing congestion. Many cities have also implemented new technologies that reduce congestion by improving the efficiency of the transportation system. The Smart Planning Consortium will work with the regional transportation planning agencies to develop a strategy for limiting congestion.
Map 6.2 - Dubuque County Level of Service 2040
Dubuque County Regional Comprehensive Plan
Dubuque County
Level of Service 2040
| Level of Service | |
| A | |
| B | |
| C | |
| D | |
| E | |
| F |
Level of Service is calculated by dividing the observed traffic on a road segment by its capacity.
Source: DMATS, 2012; Iowa DOT, 2012
Transportation Safety
Safety is an important consideration when planning for the future of the transportation system. Outdated or deteriorating infrastructure, high traffic volumes,
Transit
Dubuque County is served by two full-time transit systems and one volunteer transit program. The Jule (formerly known as Keyline Transit) serves the City of Dubuque, Region 8 Regional Transit Authority (RTA) serves Dubuque County, and DuRide is a nonprofit program that serves residents older than sixty-five.
The Jule provides public transportation for citizens to and from their destinations on fixed routes and door to door services. The Jule currently operates seven fixed route lines within the city limits of Dubuque. Map 6.3 displays The Jule’s routes. Fixed route ser-
Map 6.3 – The Jule Transit Routes
Dubuque County Regional Comprehensive Plan
The Jule - City of Dubuque Transit Routes
- Green Line
- Grey Line
- Medical Loop
- Red Line
- Shopping Circulator North Loop
- Shopping Circulator South Loop
- Trolley Service
Source: City of Dubuque, 2012
vice provides Dubuque citizens with access to services, shopping, entertainment, community functions, and employment opportunities within the City. The Jule operates a fleet of (14) 30–35' fixed route buses all equipped with ADA accessible lifts. Fixed route hours of service are from 6:00 a.m. to 6:20 p.m., Monday through Friday and from 8:00 a.m. to 5:30 p.m. Saturday.
The Jule's minibus provides seniors and persons with disabilities with demand response transportation and passenger assistance anywhere within Dubuque city limits. Passengers request minibus services by calling the transit operator, who dispatches a vehicle to pick up and transport the passenger to their destination. The minibus is available to anyone over the age of 65 or anyone over 18 with a documented disability. Minibus hours of operation are Monday through Friday between 6:20 a.m. and 6:00 p.m. and Saturdays between 7:50 a.m. and 5:30 p.m. The Jule currently operates 10 ADA accessible light duty buses.
The Region 8 Regional Transit Authority (RTA) provides ADA accessible transportation to the cities and rural areas of the Regional Planning Area 8 which includes Delaware, Dubuque, and Jackson Counties. RTA provides many cities with daily inter and intra-city service, while other communities have service several times per week. The RTA also serves rural residents through its demand response service. The Region 8 RTA operates a fleet of 27 lift equipped light duty buses, 2 ramp accessible minivans, and 2 non-ADA standard vans. Map 6.4 shows RTA's transit routes within Dubuque County.
Map 6.4 - RTA Transit Routes
DuRide is a volunteer operated nonprofit transportation program. Volunteers use their own vehicles to provide at-cost rides to Dubuque, Asbury, and East Dubuque residents age 65 and older. DuRide charges a $40 annual fee and a small pick up fee of three to five dollars for each trip. DuRide uses an account system so riders do not have to pay during their ride. Consumers are encouraged to donate their vehicles they no longer use, in exchange for credit towards their ride account.
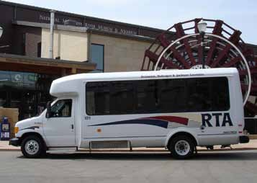
Future Needs
As part of the DMATS and RPA 8 2011-2015 Passenger Transportation Plan (PTP), staff conducted a public input process. The goal of this process was to identify steps transit providers could take to improve the system. Figure 6.2 shows the top five improvements identified for The Jule and the RTA through the public meetings and surveys.
Figure 6.2 - Future Needs DMATS & RPA
| RTA | The Jule |
|---|---|
| 1. Expand hours and days of service | 1. Expand hours and days of service |
| 2. Maintain a constant schedule | 2. Provide greater accessibility to services |
| 3. Expand services within Dubuque | 3. Expand services within community |
| 4. Expand service to the West End | 4. Cover a greater geographic area (Key West & West End) |
| 5. Add an extra Iowa City route | 5. Market employer incentives for mass transit |
Source: Passenger Transportation Plan DMATS and RPA 8 FY 2011-2015.
The Jule and the RTA hope to improve transit service and increase ridership by implementing the improvements listed above. Figure 6.3 shows the annual ridership for the Jule and the RTA for the past five years.
Figure 6.3 - DMATS & RPA Annual Ridership
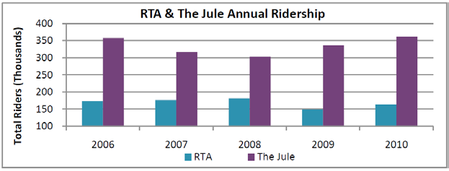
Source RTA, 2011; The Jule, 2011
Bicycle and Pedestrian
Non-motorized transportation is a key component of a multi-modal transportation system. Good walking and biking facilities can improve quality of life by reducing the number of vehicles on the road, promoting an active lifestyle, attracting visitors to the area, and providing a low cost mode of transportation. Map 6.5 displays the existing bike and pedestrian facilities in Dubuque County. In recent years, Dubuque County has worked to integrate bike and pedestrian facilities into its transportation network. However, according to the 2000 census only four percent of the population walked to work, and less than one percent rode a bike. The Smart Planning Consortium will support programs that make walking and biking safer and more convenient. This element of the Comprehensive Plan will focus on the development of the bike and pedestrian segment of the regional transportation system.
Dubuque County’s bike and pedestrian facilities fall into two categories, separated and on-street facilities. A separated facility is a bikeway/walkway physically separated from motorized traffic by open space or barrier either in the highway right-of-way or in an independent right-of-way. Separated facilities are suitable for all pedestrians and bicyclists. Examples of separated facilities in Dubuque County include the Heritage Trail and the NW Arterial Trail. When using on-street routes, bicyclists share space with motorized vehicles. On-street routes can take several forms including bike lanes or shared roadways. In some cases, a portion of the roadway is designated for the preferential or exclusive use of bicyclists by striping, signing, and pavement markings. In other cases, an on-street route is designated by signage only.
Map 6.5 - Bike and Pedestrian Facilities
Dubuque County Regional Comprehensive Plan
Bike and Pedestrian Facilities
On-Street Route Separated Trail U.S. Highway State Highway County Road
Source: City of Dubuque, 2012
that indicates that the route is safe for bicyclists. The Eagle Point On-Road Route in the City of Dubuque is an example of a signed on-street route, and Radford Road in the City of Asbury is an example of a bike lane.
When planning a bicycling, hiking, and walking system, local governments should design a system that will accommodate as many users as possible. The system should take into consideration the differing abilities of the potential riders using the system. The Federal Highway Administration (FHWA) uses the following categories of bicycle users to assist in determining the impact that different facilities and roadway conditions will have on the bicyclist. Group A riders have the most experience, and are comfortable riding on most city streets. Group B bicyclists are less experienced and prefer riding on separated trails or low speed low traffic volume streets. Group C bicyclists are children. Children often use bicycles to get to school or recreation, but require well defined separation from motor vehicles.
Transportation
The Bicycle Federation of America estimates that out of nearly 100 million people in the United States that own bicycles, roughly 5 percent qualify as Group A bicyclists, with the remaining 95 percent as Group B and C bicyclists. See Figure 6.4 for the bike and pedestrian facilities in Dubuque County.
Future Needs
Safety – Improving bicycle and pedestrian safety will be a primary concern for the Dubuque County Region. According to data compiled by the group Transportation for America, when compared to other metro areas in Iowa, Dubuque County has the highest percentage of traffic deaths that were pedestrians (9.0%), and is tied for the second highest per capita pedestrian fatality rate (0.8). See Figure 6.4.
Distance – Apart from the City of Dubuque, Dubuque County is a low-density rural region. The County's rural character means that walking or bicycling to a destination can be difficult because of the long distances involved. Local governments can help reduce travel distances by encouraging compact development that reduces sprawl and promotes land use patterns that create more walkable neighborhoods. Examples of this include conservation subdivisions, mixed-use development, and infill development.
| Metro area | Total pedestrian fatalities | Percent of all traffic deaths that were pedestrians | Fatality rate per 100,000 persons | 2009 population |
|---|---|---|---|---|
| Dubuque | 7 | 9.0% | 0.8 | 93,072 |
| Ames | 6 | 8.0% | 0.7 | 87,214 |
| Omaha-Council Bluffs | 64 | 8.0% | 0.8 | 849,517 |
| Sioux City | 14 | 8.0% | 1 | 144,360 |
| Davenport-Moline-Rock Island | 25 | 6.8% | 0.7 | 379,066 |
| Des Moines-West Des Moines | 34 | 6.8% | 0.6 | 562,906 |
| Waterloo-Cedar Falls | 12 | 6.7% | 0.7 | 164,913 |
| Cedar Rapids | 13 | 5.7% | 0.5 | 256,324 |
| Iowa City | 6 | 3.8% | 0.4 | 152,263 |
| Data Source: Dangerous by Design 2011, Transportation for America. http://t4america.org/resources/dangerousbydesign2011/states/?state=ia | ||||
help reduce travel distances by encouraging compact development that reduces sprawl and promotes land use patterns that create more walkable neighborhoods. Examples of this include conservation subdivisions, mixed-use development, and infill development.
Infrastructure – Incomplete infrastructure prevents many Dubuque County residents from walking and biking. Map 6.5 shows that there are many gaps in the regional trail and on-street bicycle route network, and many towns in the County have incomplete or inadequate sidewalk networks. Local governments can fill the gaps in the bicycle and pedestrian network by working to obtain funding for trails and other facilities, and by exploring new sidewalk or Complete Streets policies. Complete Streets are designed to allow pedestrians, bicyclists, and transit to travel safely alongside automobiles.
Freight
The efficient movement of goods is one of the keys to effective competition in the world market system. As a result, policymakers, industry specialists, and transportation planners have recognized that an efficient freight system is fundamental for economic development in Dubuque County. This section focuses on the three freight modes which are most active in Dubuque County: water-borne, truck, and rail. Each of the freight modes are described separately, but the different modes are often used in combination, which is referred to as intermodal freight transport.
The Mississippi River serves as a valuable asset to Dubuque County, providing direct connectivity to 10 states and numerous cities. The river is currently being used for incoming and outgoing freight. The County is also located on US Hwy 20, US Hwy 61/151, and US Hwy 52. These highways provide a ground connection to the rest of Iowa, Illinois, and Wisconsin and the nation. The rail system that passes through the region is another valuable resource. Two rail lines pass through Dubuque County. The Canadian National Railroad runs east and west across the county, and the Canadian Pacific runs north and south through the county along the Mississippi River. Air transport accounts for a small portion of the freight moving in and out of Dubuque County. Cedar Rapids, IA and Rockford, IL are located within reasonable driving distance and both serve as major air freight hubs for the surrounding area.
This element of the Dubuque County Comprehensive Plan will focus on the current and predicted freight movement patterns as well as existing barge, and rail facilities in the region. Freight data used was compiled for the Iowa DOT by Reebie Associates in 2000 and is displayed in Figure 6.5.
Freight moving out of Dubuque County to the State of Iowa consists mainly of products in the following categories: ordnance or accessories, food or kindred products, and chemicals or allied products. Freight originating in Dubuque County was expected to increase by 66.9% between 2001 and 2011. Freight moving into Dubuque County from in state, consists mainly of products in the following categories: Food or kindred products, primary metal products, machinery, and lumber or wood products. Freight terminating in Dubuque County was expected to increase by 69.5% between 2001 and 2011.
Freight moving out of Dubuque County and the state of Iowa consists mainly of products in the following categories: chemicals or allied products, food or kindred products, and transportation equipment. Freight originating in Dubuque County was expected to increase to all surrounding states and national regions with the exception of the North Prairie region. Freight moving into Dubuque County, not including that from in state, consists mainly of products in the following categories: chemicals or allied products, fabricated metal products and primary metal products. Freight terminating in Dubuque County was also expected to increase from all states and national regions with the exception of North Dakota.
For more information on Dubuque County Freight Transportation, please refer to the RPA and DMATS Long Range Transportation Plans. www.eciatrans.org.
Figure 6.5 - Freight Movement
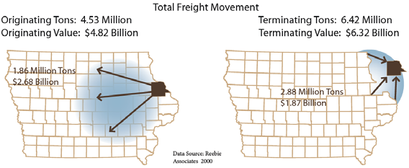
Source Reebie Associates, 2000
Airport
The Dubuque Regional Airport is located approximately seven miles south of downtown Dubuque on US Hwy 61. The airport occupies 1,057 acres and has a field elevation of 1,076 feet. The airport opened at the present location in 1948. The airport has two runways and five taxiways to support air operations. Runway 18-36 is a north-south oriented runway that serves as the airport's primary runway. The runway is 6,325 feet long and 150 feet wide. Runway 13-31 is a northwest-southeast oriented runway and serves as the airport's secondary runway. The runway is 6,498 feet long and 100 feet wide. Taxiways provide access to both of the runways and consist of parallel, connecting, access and entrance/exit taxiways. American Eagle Airlines offers four daily flights from the Dubuque Regional Airport to Chicago O'Hare International Airport.
The Dubuque Regional Airport's groundside facilities serve passengers, freight, airport administration, and general aviation needs. The original terminal building was constructed in 1948, and a new terminal was constructed next to the existing one in 1969. In 1989, the two buildings were remodeled and combined to form the 11,656 square foot terminal that exists today. Other airport buildings include six T-hangers and six conventional/executive hangar buildings. The airport has 440 parking spaces in five parking lots that are available for use by airport patrons, employees, and other airport users.
The Dubuque Regional Airport Master Plan guides City of Dubuque in the overall development of the airport. Coffman Associates, Incorporated of Lee's Summit, Missouri, updated the plan in 2004. According to the Airport Master Plan, based aircraft at the airport totaled 79 aircraft in 2003. There were an estimated 55,009 total annual operations conducted in 2003. Of that total, general aviation had 48,447
Figure 6.6 - Total Operations
Data Source: FAA Terminal Area Forecasts 2011
Figure 6.7 - Total Enplanements
70,000 60,000 50,000 40,000 30,000 20,000 10,000
2000 2005 2010 Forecasted 2015 2020 2025 2030
Special Transportation Initiatives
The goal of the Safe Routes to School (SRTS) program is to enable community leaders, schools and parents across the United States to improve safety and encourage more children to walk and bicycle to school safely. The Dubuque Safe Routes plan seeks to achieve this goal through two objectives. The first objective is to involve a variety of local entities in the planning process. Involving city, county, and school officials in the planning process will ensure that parents, local governments, and the schools are communicating and working together on walking and biking projects. The second objective of the plan is to provide a list of projects for each school that, when implemented, will provide students with safer opportunities to walk and bike to school and encourage students to take advantage of these opportunities. The project list can be used to guide future investments in walking and biking. Following success of the SRTS planning process within the City of Dubuque, DMATS received grant funding to implement the SRTS planning process in the Western Dubuque School District. Planning funds were awarded in January of 2009, and the planning process is currently underway. For more safe routes information please visit http://www.eastiowasaferoutes.org/.
The City of Dubuque has committed to continuing to use Intelligent Transportation Systems (ITS) to improve safety and traffic flow within the City. According to the City of Dubuque's ITS System plan, ITS technology is used to coordinate signals and improve traffic progression, reduce incident clearance times, improve real-time traveler information, and enhance special event management. Technologies used include message boards, traffic sensors, traffic cameras, fiber optic communications, and wireless
Transportation
The City of Dubuque has begun construction of a fiber optic backbone along the Iowa Highway 32 (Northwest Arterial) and through other parts of the downtown area. A long-term signal communications loop would minimize the impact of losing signal communications. For more ITS information, please refer to the City of Dubuque's ITS System Plan.
http://www.cityofdubuque.org/index.aspx?NID=1265
DMATS has undertaken an initiative to align the transportation system with the principles of sustainability. A sustainable transportation system is one that provides transportation in a way that promotes Environmental/Ecological Integrity, Economic Prosperity, and Social/Cultural Vibrancy. One way the city is implementing this initiative is through a Complete Streets policy. In April of 2011, the City of Dubuque adopted a Complete Streets policy. According to the policy, complete streets are those “streets that support and invite multiple uses, including safe, active, and ample space for pedestrians, bicycles, and public transportation, are more conducive to the public life and efficient movement of people than streets designed primarily to move automobiles and trucks.” The policy requires that the Dubuque City Council consider complete streets when building or rebuilding a street.
Goals and Objectives
The following goals and objectives are intended to guide the communities of Dubuque County in providing high quality transportation to all residents of Dubuque County by maintaining the existing intergovernmental and public-private facilities relationships, and looking for areas to establish new relationships.
- To maintain a system of highways, roads, and streets that provide safe and efficient movement of goods and people.
- To establish and improve a more efficient traffic circulation system, which recognizes major community facilities, future planned development areas, and employment centers.
- Maintain current road design and construction standards based on the Federal Functional Classification map, which should be reviewed as needed to reflect changing traffic conditions.
- Design and construct all existing and proposed roads in accordance with the current Design Characteristics for the Federal Functional Classification System, the policies of this Plan, and adopted improvement standards.
- Maintain a system of highways, roads, and streets that minimize long-term capital and operations costs, while providing safe and convenient land access.
- Require new developments in the unincorporated area of the County to provide for the long-term maintenance of internal street systems, including driveways and frontage roads.
- Investigate methods and standards to limit the number of new direct driveway accesses to County roads generated by residential and commercial development, including shared driveways and private frontage roads with properly designed drainage.
- Support the ongoing street construction program, providing for timely maintenance, repair and reconstruction of the street system.
- Encourage implementation of sound safety engineering principles and practices in the area of street lighting, street layout, speed limits, street signage, street pavement striping, and traffic signals.
- Provide adequate street lighting which minimizes light pollution, maximizes energy efficiency, and ensures compatibility with neighborhoods.
- Incorporate the Complete Streets Design Concept for construction and construction of all main transportation routes for all modes of transportation involving pedestrians, cyclists, and vehicles in accordance with the DMATS Complete Streets Policy.
- To secure adequate right-of-way and facility improvements to serve development and maintain acceptable levels of service.
- Ensure that safe and adequate roadway facilities are provided concurrently with new development.
- Require roadway improvements to be constructed to current County or City standards as defined for each street classification.
- Plan roadway improvements that maintain acceptable levels of service on all county roads, including modern vehicles used for agricultural and construction purposes.
- To plan long-range for both local and regional street and highway systems to ensure safe, efficient access into and through the region; to support urban growth in an appropriate development pattern; and to facilitate improved four-lane access for surface transportation from Dubuque to major cities in the region.
- Continue to promote and support the completion of the modern four-lane highway system in the County, which includes the Julien Dubuque Bridge, the Southwest Arterial, and the completion of Highway 52 North as a Super-Two Lane.
- Work with regional transportation agencies to maintain and update a long-range transportation plan and coordinate highway plan-
ning and construction in the development of an improved highway system to serve the region.
- Improve the existing street network to reduce traffic capacity restraints and improve safety.
- Encourage the involvement of the public in the transportation planning process.
- Plan for aesthetically appealing streets and highways, with particular focus on gateway opportunities and street tree plantings.
- Promote signage to identify historic neighborhoods and gateways, and actual physical entrances to other neighborhoods to provide identity of neighborhoods and districts.
- Encourage public/private partnerships with local, regional, state, and federal agencies to plan and promote future transportation facilities.
- Support a street and highway system that meets current and future traffic needs.
4. Formalize policies for property acquisition necessary for future transportation Rights of Way (ROW).
- Publicize plans for possible future property acquisition early in the planning phase.
- Involve the affected property owners in meaningful plan development meetings.
5. To encourage efficient, affordable, and accessible transit systems in the region for the transit-dependent population and as an alternative means of transportation.
- Promote meeting the changing needs of the transit dependent.
- Support the needs of both existing and new housing developments, as well as service to medical centers and care centers, as demand arises.
- Explore and use capital and operating assistance grants from state, federal, and other agencies to the maximum extent possible.
- Promote a safe, clean, energy efficient, timely, affordable, and comfortable mode of public transportation.
- Promote the best possible transit system in the most cost-efficient manner.
- Promote use of appropriately sized vehicles for needs of community to meet demand.
- Consider extending and expanding public transportation to ensure service is available for transit-dependent people to get to and from work on all shifts and to meet demands of business hours.
- Encourage youth and recreation opportunities with public transportation.
- Encourage mass transit through partnership with businesses.
- Consider creating a loop system that comes to specific transfer points to encourage shorter routes, to improve routes for efficiency and cost effectiveness, and to make sure transportation goes to neighborhoods where the need is.
- Consider providing bike racks on buses to encourage multimodal transportation in the region.
- Maintain and expand para-transit systems to serve special needs citizens, the elderly, and the disabled.
6. To maintain safe and efficient utilization of the Mississippi Riverfront for both land and water based commercial, industrial, and recreational traffic.
- Cooperate in the implementation of the four planning components of the Riverfront Plan with other public and private organizations.
- Promote adequate harbor, channel, and dock depths.
- Encourage development and maintenance of riverfront facilities.
- Promote compatibility of riverfront redevelopment with historically existing businesses located at the river because of transportation needs (i.e. barge).
7. To provide safe and efficient airport services to the community and the region, in coordination with the Airport Master Plan.
- Promote the Dubuque Regional Airport as the center of airline passenger activity for northeast Iowa, northwest Illinois, and southwest Wisconsin.
- Consider expanding the air cargo, commercial air, affordable jet airline, and general aviation services provided at the Dubuque Regional Airport.
- Consider developing portions of the Dubuque Regional Airport for industrial uses, both aviation and non-aviation related.
- Promote airport planning, regulations, and standards to control conflicts in and around airport facilities.
- Implement the Airport Master Plan, through various funding resources, as available.
- Cooperate with private businesses to promote transportation between the city and the airport.
- Cooperate with regional business partners to expand the "Fly Dubuque" program.
- Work with county authorities to promote a shared-ride system and develop a list of volunteers for a transportation escort service.
8. To support rail opportunities for both commercial/industrial and passenger service.
- Explore cooperatively rail, river, and trucking appropriate multi-modal access, which will promote an efficient system throughout the region.
- Cooperate with railroads and other private concerns to develop mutually acceptable arrangements for the locations of terminal facilities.
- Encourage reduction of train conflicts with other modes of transportation.
- Support the reintroduction of passenger rail service into the region.
- Consider alternate routes for truck freight into commercial and industrial areas not affected by train traffic.
9. To establish improved pedestrian and bike routes in the region to encourage alternative modes of transportation.
- Continue to develop a comprehensive regional system of bikeways and/or multipurpose trails which minimize conflicts between motor vehicles, bicycles, and pedestrians.
- Continue to develop a bike and pedestrian system that links residential areas, parks, schools, and other local attractions, while providing the opportunity for recreational activity.
- Promote a more bicycle- and pedestrian-friendly transportation network.
- Consider relevant bicycle and pedestrian elements in all new transportation projects in accordance with the DMATS Complete Streets Policy.
- Encourage development patterns more compatible with non-motorized travel. (i.e. complete streets, transit oriented development, mixed use development.)
- Promote bike trails along arterials and as part of new subdivision development wherever possible.
- Promote bicycles as a viable alternative mode of transportation, using signs, striped lanes, and safe crossings.
- Promote bike and pedestrian network continuity within the region and support connections to regional bike and pedestrian networks.
- Establish trail linkages to the Mississippi River Trail to increase recreational tourism.
- Coordinate with other jurisdictions and authorities, including the Iowa Department of Natural Resources, to determine access points to, and extensions of, existing facilities.
10. To encourage the use of sustainable design concepts to reduce the transportation system’s impact on the natural environment.
Transportation
- Encourage the use of permeable pavement and other best management practices (BMPs) that allow for storm water infiltration.
- Encourage the use of BMPs that prevent soil erosion during project construction.
- Reduce vehicle emissions and vehicle miles traveled to protect air quality.
- Protect agricultural land and open space by encouraging more infill development in existing urban areas, and by encouraging more compact development near existing urban areas.
11. To improve coordination between land use and transportation planning.
- Encourage development where land use supports multimodal transportation; e.g. transit oriented development or mixed use neighborhoods.
- Establish general locations for future collector street right-of-ways well in advance of expected need for future street construction primarily at developer expense.
- Locate affordable housing in areas where multiple transportation modes are available.
- Direct development to areas already connected to the transportation network.
- Limit future commercial development along the freeways and other major thoroughfares to uses directly related to transient traffic and to commercial activities not compatible with the downtown Central Business District cores of communities in the region.
Map 6.6 - Dubuque County Federal Functional Classification
Map 6.7 - City of Asbury Federal Functional Classification
Transportation
Map 6.8 - City of Cascade Federal Functional Classification
Map 6.9 - City of Dubuque Federal Functional Classification
Map 6.10 - City of Dyersville Federal Functional Classification
Map 6.11 - City of Epworth Federal Functional Classification
Map 6.12 - City of Farley Federal Functional Classification
Map 6.13 - City of Peosta Federal Functional Classification
Severe Roadway Crashes
Crash Severity
● Fatalities
● Major Injury
● Minor Injury
Crash Data: Iowa DOT, 2012
Map Created by ECIA, 2012
Severe Roadway Crashes
Crash Severity
● Fatalities
● Major Injury
● Minor Injury
Crash Data: Iowa DOT, 2012
Map Created by ECIA, 2012
Transportation
Map 6.16 - City of Cascade Severe Roadway Crashes
Map 6.17 - City of Dubuque Severe Roadway Crashes
| DUBUQUE COUNTY REGIONAL COMPREHENSIVE PLAN |
| City of Dyersville |
| Severe Roadway Crashes |
- Crashes (2001 - 2009)
- Crash Severity:
- Fatalities
- Major Injury
- Minor Injury
- Date: Dubuque County, 2012.
- Source: Dubuque County, 2012
- Crash Data: Iowa DOT, 2012
- Map Created By ECIA, 2012
| DUBUQUE COUNTY REGIONAL COMPREHENSIVE PLAN |
| City of Epworth |
| Severe Roadway Crashes |
- Crashes (2001 - 2009)
- Crash Severity:
- Fatalities
- Major Injury
- Minor Injury
- Date: Dubuque County, 2012.
- Source: Dubuque County, 2012
- Crash Data: Iowa DOT, 2012
- Map Created By ECIA, 2012
Transportation
Map 6.20 - City of Farley Severe Roadway Crashes
Map 6.21 - City of Peosta Severe Roadway Crashes
Development
Chapter 7
A diverse vibrant regional economy is a critical component of the foundation of a sustainable community. Good jobs that pay a living wage and access to goods and services are important factors in measuring a community’s quality of life. This chapter describes the data, policies, and organizations that address issues of employment, industry, and commerce in a sustainable way.
Data Analysis
As Dubuque County strives to build a more vibrant economy through more effective local policies, local governments need to have informative data and maps that illustrate the economic forces at work. The US Census Bureau, Bureau of Economic Analysis (BEA), and the Bureau of Labor Statistics (BLS) provide a wide variety of economic data through the Decennial Census and the American Community Survey (ACS). The following charts and tables are selections from the Census that depict the most important aspects of the Dubuque County economy.
Figure 7.1 - Dubuque County Historical Employment
Source: US Bureau of Labor Statistics
Employment
Over the last 20 years, Dubuque County has experienced positive growth in total employment. The total number of jobs has increased from 44,800 in 1990 to 56,500 in August 2010. Figure 7.1 illustrates the overall positive growth in employment since 1990.
Since 2000, Dubuque County’s unemployment rate has mirrored the State of Iowa’s rate. Based on the BLS data presented in Figure 7.2, both Dubuque County and the State of Iowa have fared well in the recession. Current unemployment rates are approximately 3 percentage points lower than the national average. Figure 7.2 shows the Annual Unemployment Rate for Dubuque County, the State of Iowa, and the United States.
Figure 7.2 - Annual Unemployment Rate
Source: US Bureau of Labor Statistics
Employment growth is expected to continue over the next 30 years. According to projections made by Regional Economic Model Inc. (REMI), total employment in Dubuque County will reach 72,000 by the year 2040. Figure 7.3 depicts the REMI 30-year employment projection.
Figure 7.3 - Dubuque County Employment Forecast
Source: REMI Inc. 2010
Information on employment by industrial sector is available through the US Census Bureau’s County Business Patterns (CBP) dataset. The CBP is an annual series of data that provides county economic data by industry. County Business Pattern data excludes most government employees, railroad employees, and self-employed persons. Figure 7.4 contains the most recent CBP data from 2009. According to the CBP data, the Manufacturing, Health Care, and Retail Trade industries are the largest employers in the region. These three industries account for almost 50% of the employment in Dubuque County.
Figure 7.4 - 2009 County Business Patterns*
| Industry | Paid Employees | Percentage of Total Employees | Annual Payroll ($1,000) | Total Establishments |
|---|---|---|---|---|
| Total for all sectors | 52,354 | - | $1,721,358 | 2,745 |
| Manufacturing | 8,499 | 16.2% | $363,589 | 155 |
| Health care and social assistance | 7,666 | 14.6% | $302,535 | 255 |
| Retail trade | 7,280 | 13.9% | $143,440 | 441 |
| Accommodation and food services | 4,399 | 8.4% | $42,820 | 249 |
| Finance and insurance | 2,793 | 5.3% | $125,054 | 207 |
| Educational services | 2,656 | 5.1% | $52,368 | 40 |
| Wholesale trade | 2,613 | 5.0% | $102,417 | 166 |
| Other services (except public administration) | 2,284 | 4.4% | $46,867 | 251 |
| Transportation and warehousing | 2,210 | 4.2% | $80,099 | 120 |
| Construction | 2,078 | 4.0% | $91,706 | 304 |
| Information | 1,985 | 3.8% | $87,706 | 54 |
| Arts, entertainment, and recreation | 1,912 | 3.7% | $35,788 | 57 |
| Professional, scientific, and technical services | 1,851 | 3.5% | $67,785 | 170 |
| Administrative and support and waste management and remediation services | 1,723 | 3.3% | $40,327 | 123 |
| Management of companies and enterprises | 1,468 | 2.8% | $100,481 | 22 |
| Real estate and rental and leasing | 441 | 0.8% | $12,426 | 105 |
| Utilities | 346 | 0.7% | * | 7 |
| Forestry, fishing, hunting, and agriculture support | 112 | 0.2% | $2,266 | 16 |
| Mining, quarrying, and oil and gas extraction | 19 | 0.0% | * | 1 |
| Industries not classified | 19 | 0.0% | * | 2 |
US Census Bureau, 2009
* Data withheld to avoid disclosing data for individual companies
Figure 7.5 - Total Primary Jobs by City 2009
| Total Dubuque County Primary Jobs+ | |
|---|---|
| Asbury | 404 |
| Cascade* | 970 |
| Dubuque | 38,582 |
| Dyersville* | 2,343 |
| Epworth | 258 |
| Farley | 810 |
| Peosta | 1,338 |
| Dubuque County | 49,331 |
| US Census Bureau, 2009 |
*Cities in more than one county, jobs totals include portions of city outside of Dubuque County.
+ Public and Private sector jobs, one job per worker. A primary job is the highest paying job for an individual worker.
Economic Development
Maps
To better understand the distribution of employment across Dubuque County, employment data has been mapped using the US Census Bureau On the Map service. On the Map uses data derived from Unemployment Insurance Wage Records reported by employers and maintained by each state for the purpose of administering its unemployment insurance system.
Map 7.2 (at the end of the chapter) was created using On the Map. The map shows the density of employment across the county. According to the map, the highest density of employment in the county is located in and around Dubuque's downtown. Employment density is also high in Dubuque's west end commercial area. Other areas of moderate employment density occur at locations across the County with the larger densities mainly within the larger cities.
Map 7.1 - Dubuque County Employment & Outflow 2009
Live In
Grant County WI 2,200
Jackson County, IA 1,745
Delaware County, IA 1,285
Jo Daviess County, IL 1,212
Linn County, IA 903
Black Hawk County, IA 677
Scott County, IA 675
Polk County, IA 622
Clayton County, IA 547
All Others 6,740
Work In
Linn County, IA 1,961
Scott County, IA 1,551
Jo Daviess County, IL 838
Johnson County, IA 830
Polk County, IA 756
Black Hawk County, IA 597
Delaware County, IA 403
Clinton County, IA 373
Jones County, IA 357
All Others 4,036
U.S. Census Bureau. 2011. OnTheMap Application. Longitudinal-Employer Household Dynamics Program. http://lehdmap.did.census.gov/
ter in Maps 7.3-7.9. This series of maps shows the flow of workers in and out of each community. The arrows show the numbers of workers that commute to the city to work, the number of workers that live and work in the city, and the number of workers that live in the city but work elsewhere. The tables below the arrows show where workers who commute to the city come from, and where the workers who leave for work go. These maps are important for understanding the complex interactions among communities within Dubuque County.
Economic Development Agencies
Several public and private organizations are working within Dubuque County to help improve the local economy. These organizations provide aid to small businesses, administer state programs, and help create and implement effective local policies to foster economic growth and prosperity.
Community Economic Development
Cities in Dubuque County are working to encourage business growth in their communities. When businesses expand or relocate, they usually are pushing the financial limits and they need financial support packages from communities they are considering for expansion or relocation. Communities provide access to several programs which can be tapped to encourage business development. Some of the tools used by communities include:
- Tax Increment Financing (TIF) – An incentive program which captures the increased property taxes a business pays from improving their property. This incentive can be used to help pay for needed infrastructure improvements or to provide grants/rebates to the business. Businesses must commit to job creation in the community or must have an extraordinary positive impact for the community to offer this incentive.
- Low Interest Loans – Loans for building improvements are available if a qualified project locates within certain areas of the community.
- Land Discount – Communities provide a land discount if the business commits to significant job creation in the community.
- State of Iowa Programs – Programs like the Community Economic Betterment Account (CEBA), Enterprise Zone Benefits, Revitalize Iowa’s Sound Economy (RISE), and the Iowa Values Fund are available from the State of Iowa for qualifying projects.
- Jobs Training – The State of Iowa’s 260E and 260F programs provide employee training through the Iowa’s 15 community colleges. 260E provides training to businesses that are expanding their Iowa workforces, and 260F provides training to existing Iowa businesses. Northeast Iowa Community College administers these programs in Dubuque County.
East Central Intergovernmental Association (ECIA)
ECIA manages a number of economic development programs. ECIA Business Growth Inc., a non-profit corporation formed in 1982, provides low-interest loans to businesses for expansion that creates new or retains current jobs. The Small Business Administration is the primary funding source. ECIA Business Growth Inc. has extended loans in excess of $68,518,199 and has created or retained more than 4,615 jobs. ECIA Business Growth Inc. also assists local communities in the administration of Revolving Loan Funds. These funds are loaned to businesses and industries, and the proceeds are returned to the local governments for future loans. Other economic development initiatives managed by ECIA include:
- Prosperity Eastern Iowa is a four-county economic development region including Delaware, Dubuque, Jackson, and Jones Counties and the cities of DeWitt and Marion.
- Buyer Supplier is an organization dedicated to connecting buyers and suppliers of all types of products and services in Eastern Iowa.
- The Petal Project is a green business certification program that provides organizations with a framework for reducing their energy, water, and natural resource use to benefit the environment and their bottom line.
- AccessMyFuture.com is an interactive website that explores careers in the region and provides links to a variety of job search sites within the region,
including: accessdubuquejobs.com, De Witt Delivers Careers, Delaware County job listings, Iowa Workforce Development and a host of others. This project is a collaboration between a number of organizations in the region with the main focus of increasing the number of skilled trade professionals.
Economic Development
Chambers of Commerce
Chambers of commerce play an important role in economic development in Dubuque County. Chambers are organizations of businesses that work to further the needs of other businesses and promote tourism activities. Chambers work on the local level to bring businesses together and develop strong social networks. Chambers also work with local governments to help create pro-business initiatives. In Dubuque County, the Dubuque Area Chamber of Commerce, the Dyersville Area Chamber of Commerce, the Cascade Chamber of Commerce and the West Side Business Association of Dubuque work to promote and protect local businesses and work to make their communities better places to live.
Economic Development Corporations
Economic Development Corporations are not-for-profit organizations that work closely with government, business, and other partner organizations to promote economic development through recruitment and retention of industry, tourism promotion, workforce development, and employee recruitment and retention. There are several active economic development corporations in Dubuque County including: Asbury Area Development Corporation, Cascade Economic Development Corporation, Greater Dubuque Development Corporation, Dyersville Economic Development Corporation, Epworth Economic Development Corporation, Farley Development Corporation, and Dubuque Main Street.
Economic Challenges, Strengths, and Opportunities
ECIA produces a Comprehensive Economic Development Strategy (CEDS) every five years to monitor and evaluate long-term economic goals and strategies and to coordinate the development activities in a five-county region that includes Dubuque County. In its most recent edition, completed in January 2010, the CEDS outlines the most important economic development challenges and opportunities
that are facing the region. The following list contains the challenges, strengths, and opportunities that were listed in the 2010-2014 CEDS and the 2011 CEDS Annual Update.
Challenges
Future Shortage of Skilled Workers
The Dubuque County regional economy faces a future shortage of skilled workers because of retirements. In October 2011, Iowa Workforce Development (IWD) released the Iowa Workforce Needs Assessment for the region that includes Dubuque, Delaware, Jackson, and Jones Counties. The Needs Assessment found that as the baby boomer generation begins to retire, employers in Dubuque County will be forced to replace and train thousands of skilled workers. According to the IWD, several industries in Dubuque County will have large percentages of their workforce eligible to retire in the next five years. The industries with the highest retirement eligibility include Educational Services (30.4%), Health Care and Social Services (25.9%), Manufacturing (14.0%), and Wholesale and Retail Trade (6.5%).1 The report detailed what employers are doing to replace workers who retire. Of the employers who replied to IWD's survey, 33.4% plan to use a combination of outside workers and promoting within the company, 31.0% do not currently plan on filling these positions, 29.1% plan only to hire workers from outside the company, and 6.5% plan only to promote from within the company.
Gender Wage Gap
Wage inequality between men and women is an-
Figure 7.6 - Gender Wage Gap
Source: Iowa Policy Project
other issue that is facing Dubuque County. According to the Iowa Policy Project's 2011 report The State of Working Iowa, "the gap between women's and men's earnings has narrowed with time, nationally as well as in Iowa. The lowest gap of $2.60/hour was measured in 2010. However, this appears to be largely due to a decline in the earnings of men."2 Figure 7.6 shows a chart depicting the results from the Iowa Policy Project's analysis.
Natural Disasters
In recent years, the region has been hit hard by natural disasters. In the past five years, tornados and floods have caused billions of dollars in damage across the State of Iowa. Many communities in Dubuque County are still working with federal and state agencies to rebuild damaged homes and businesses. Since 2008, Dubuque County has been included in three federal disaster declarations. These disasters include:
- 2008: Severe Tornadoes and Flooding FEMA-1763-DR – Cedar, Clinton, Delaware, Dubuque, and Jackson Counties.
- 2010: Severe Storms, Flooding, and Tornadoes FEMA-1930-DR – Delaware, Dubuque, and Jackson Counties.
- 2011: Severe Storms and Flooding FEMA-4018-DR – Dubuque and Jackson Counties.
See the Hazard Mitigation Chapter for more information on natural disasters.
Adequate Transportation Infrastructure
Adequate transportation infrastructure funding is a challenge for the region and the State of Iowa. Transportation challenges that impact Iowa and Dubuque County include: increased traffic demands and freight movements, changing demographics, increased biofuels production, increased construction and maintenance costs, flattened revenues, and aging infrastructure. According to the Iowa DOT 2011 Road Use Tax Fund Study, the transportation system will need a minimum of $215 million per year in additional funding to meet the "most critical stewardship needs on existing infrastructure."3 State legislators have debated a state gas tax increase to cover the funding gap, but the region also must work to stretch its limited transportation budget by investing its funds wisely. See the Transportation Chapter for more information on the County's transportation infrastructure.
Lack of Quality Rental Housing
Quality rental housing has become an issue for the region with the addition of IBM and their 1,300 new employees in downtown Dubuque. Rental units in the region are sparse. The average year of construction for rental units in the region is 1951, which means that many of the units are close to 60 years in age. Of the total housing units in the region, less than 30% are rental units. The IBM workforce population in search of housing is looking for rental housing. The demographic for this population is between the ages of 25-30, recent college graduates, one to two years of work experience, making $30,000 to $35,000 per year. The vacancy rental rate for the region is 1.1%, and in the Dubuque area, it is less than .05%. In the near future, the region must address the shortage of workforce rental housing. See the Housing Chapter for more information on Dubuque County housing issues.
Innovation
The wildcard for the region is innovation and entrepreneurship. The State New Economy Index ranked Iowa 45th in the nation when it comes to economic dynamism and its ability to rejuvenate itself through the formation of new innovative companies. The study focused on several indicators including the number of entrepreneurs starting businesses and the number of patents issued. The study found that the region lacks a significant institutional source for innovation such as a tier one research university or major private research and development facility. Leaders in the region agree that the region's economic future will be founded on a strong seedbed of entrepreneurs and a steady stream of talented individuals who are willing to take on the risk associated with starting new businesses. The region must find ways to integrate entrepreneurship into the K-12 curriculum to encourage it at a young age and provide a way to change the culture over time. The region must find new mechanisms to harness some of the indigenous wealth in the region and recycle it into new businesses. The region needs to pursue equity capital to fund new business start-ups. Finally, the region needs to improve delivery of support services for entrepreneurs.
2 http://www.iowapolicyproject.org/2011docs/110902-SWI2011.pdf
3 http://www.iowadot.gov/pdf_files/RUTFStudy2011.pdf
102
riculum to encourage it at a young age and provide a way to change the culture over time. The region must find new mechanisms to harness some of the indigenous wealth in the region and recycle it into new businesses. The region needs to pursue equity capital to fund new business start-ups. Finally, the region needs to improve delivery of support services for entrepreneurs.
Economic Development
Strengths
Manufacturing
Dubuque County's deep industrial and manufacturing roots make it attractive to employers. According to the US Census Bureau's 2009 County Business Patterns data, 16.2% of workers in Dubuque County are employed in the manufacturing sector. Many of the firms are locally owned. A 2009 study for the region completed by Rural Policy Research Institute (RPRI) indicates that manufacturing employment is 24-30% of the employment base in Dubuque County.4 The surrounding counties of Delaware, Jackson, Cedar, and Clinton have only a 0-6% manufacturing base. According to RPRI, manufacturing in areas such as trusses, motor vehicle seating and trim, residential electric lighting fixtures, and cut stone products, will all experience a 60%+ growth in the 2007 to 2017 time frame. This growth presents employment opportunities for residents in the region and provides a basis for educational programs to fit the needs and the demands in the region looking out to 2017.
Business Services
Business services remains a strong employment sector in the region. The business and professional services sector provides services such as consulting, processing, legal, management support, etc. to all of the other industries in the region. This sector has grown rapidly over the last several years and remains one of the fastest growing sectors nationally. Leaders in the region realize that more emphasis on growing service companies within the region will be crucial to sustaining future growth in the business services sector. Nearly 27% of the residents in the region are employed in the business services sector.
4 Drabenstott, Mark. "Strategic Opportunities for the RiverLands" Rural Policy Research Institute. Spring 2009.
Tourism
Tourism has remained strong in the region and will continue to be a priority with the National Mississippi River Museum and Aquarium, the Grand River Center, the Field of Dreams, the National Farm Toy Museum, Sundown Mountain, Heritage Trail, and the synergies that have been created between the counties in the region and the communities across state lines into Wisconsin and Illinois. Wineries have begun to crop up throughout the region as well as opportunities for eco and agri-tourism. Local tourism experts in the tri-state region indicate that high gas prices, recent credit crunch, and the nation’s plunge into the recession actually might boost small town tourism and fewer miles traveled can equal more fun. According to the CEDS, “Overall tourism dollars in our region increased by 1.98% from 2007 to 2008.” Although the national average was 3.29% (www.poweroftravel.org), rural counties outpaced the national average. This is likely due to less than ideal economic conditions that cause people to stay in their own areas for entertainment rather than travelling longer distances. For example, Cedar, Clinton and Jackson Counties had over a 5.00% change in travel impact dollars from 2007 to 2008 (www.traveliowa.com).
Opportunities
Workforce
Workforce remains a double-edged sword for the region. The region is known for its highly skilled and educated workforce, but as noted in the challenges section, retaining and recruiting younger workers to replace retiring experienced workers remains a challenge. Local economic development groups and employers have initiated efforts to address workforce issues for their communities. One such initiative is the recruitment website Accessmyfuture.com. Accessmyfuture.com is an interactive website targeting the 14-25 year old population exploring careers in the region and providing links to a variety of job search sites. Local firms have partnered with the area colleges and community colleges by connecting students to internship programs funded by the local companies. Companies in the region are also offering more flexible work schedules, telecommuting, incentives, etc. to attract and retain employees. Local
communities in the region need to continue to build off these initiatives to create opportunities to attract and retain a skilled workforce.
Passenger Rail
The proposed return of Amtrak passenger rail service from Chicago to Dubuque is a transportation related opportunity that has excited the region and has the support of both Iowa and Illinois. Amtrak completed a feasibility study in 2006. The study estimated an annual ridership of over 75,000 passengers on one round-trip per day. According to the study, the project will require $32 million in track improvements and a $3 million annual operating subsidy. The Iowa and Illinois Departments of Transportation have applied for grant funding to assist with the initial track improvement costs. Public support for the project is widespread. Over 8,000 Iowa residents and over 15,000 Illinois residents have signed a petition in support of the Amtrak service. Anticipated implementation of the new Amtrak line is 2014.
Sustainability
Sustainable development initiatives have created new business opportunities in Dubuque County. IBM was initially attracted to the Dubuque area in part because the area was already engaged in sustainability efforts. IBM created a new opportunity for the region when it announced plans to make Dubuque the first American city to participate in its Smarter Planet initiative. The Smarter Sustainable Dubuque effort involves improving sustainability on a variety of city systems. IBM will use its technological resources to improve the efficiency of water, energy, and transportation. Smarter Sustainable Dubuque is a national model for more than 1,000 other cities. Other businesses in the area have also used sustainability to grow their business. A.Y. McDonald, a Dubuque based manufacturer of water works brass and valves, produced new sustainable water meters for the City of Dubuque. The Unmeasured-Flow Reducer meter measures and accounts for small leaks throughout the home, making the homeowner more aware of unintended water usage.
The recent focus on sustainability in the region has increased investment in the manufacturing and business service sectors. According to the CEDS, “Partnerships from across the region were crucial to attracting IBM and will remain critical in the future. Part of the attraction to the region was the concentration of the educational institutions in the region that provide a ready supply of high-quality workers. Additionally, the workforce development arena remains aligned consistently with the region’s employment needs and its strategic opportunities.”
104
- To reduce unemployment, achieve economic stability, and increase the standard of living for all citizens.
- Maintain a broad community consensus regarding the direction of economic development efforts.
- Promote diversification of the commercial/industrial base.
- Encourage access to economic incentives for quality job creation and/or tax base enhancement.
- Continue to use a unified economic development team, with public/private sector involvement, to tackle the region’s economic development goals.
- Reduce barriers to economic growth, while recognizing regulatory function.
- Identify additional resources to aid in economic development.
- Maintain a community socio-demographic database as an information clearinghouse for economic development.
- To build a highly skilled, flexible workforce.
- Cooperate with local educational institutions to coordinate training/skill requirements to meet the needs of local employers.
- Reduce barriers to obtaining necessary or upgraded job skills.
- Utilize the talents and experience of mature workers who bring special skills and knowledge to the workforce.
- Maintain an informational clearinghouse that coordinates job training, placement, and skills development.
- Develop and deliver educational programming over the widest array of media.
- Provide information on work skills development and available employment opportunities through print, electronic, and telecommunications media.
- To concentrate on retaining and expanding existing local businesses.
- Cooperate with business, educational institutions, community organizations, and government to provide information to local businesses.
- Assist local firms in finding appropriate development sites for expansion.
- Encourage existing neighborhood employers to grow "in place," keeping jobs close to where people live.
- Retain existing manufacturing firms and facilitate their expansion.
- Maintain and strengthen the region's position as a retail center in the trade area.
- Maintain and expand the local health care industry's share of the regional market.
- Retain and expand the base of service industry employment.
- Encourage downtown revitalization and neighborhood business development.
- Encourage diversified retail shopping.
- Retain and expand river-dependent uses, while recognizing environmental constraints.
- To increase the number of small firms within the region by fostering local entrepreneurship.
- Cooperate with other agencies and institutions to identify programs and services to assist in the creation of new small businesses.
- Promote start-up businesses with both financial and technical assistance.
- Remove barriers to allowing in-home businesses to be successful.
- Strengthen programs which provide business development, information, and technical assistance.
- To recruit businesses that are suited to the region, require a highly skilled work force or are willing to train an entry-level work force and
- Assist businesses and industries that produce exports or import substitutes and that provide high quality jobs.
- Promote opportunities in the region to targeted businesses and industries.
- Continue a collaborative recruitment strategy among business, non-profits, and government.
- Recruit businesses with new technology and renewable resources.
- Recruit businesses that are in line with the State's economic development goals.
- Recruit businesses that utilize the by-products of other businesses.
- Recruit a variety of restaurants and retail establishments, including franchises that are not currently in the region, but that are located within the regional malls that attract shoppers from the region.
- Develop awareness of the impediments to employment for this sector of the population.
- Collaborate with unemployed and underemployed persons and potential employers to find creative ways to overcome barriers.
- Target unemployed young adults (ages 18–24) for job/skills training, providing supportive services as needed.
- Promote access to resources and tools for education, training, and supportive services through a variety of means and media.
- Encourage business, labor, education, and government partnerships to solve workforce development problems.
- Promote existing attractions.
- Promote a variety of additional year-round tourist attractions.
- Focus resources on future tourism initiatives, including those identified in the community visioning process.
- Foster enhanced recreational access to local attractions as an economic development strategy.
- Explore ways to increase state and federal funding for historic preservation.
- Explore ways to remove barriers to preservation.
- Educate the public on the economic benefits of historic preservation.
- Encourage expansion and diversification of the tax base.
- Attract and retain capital intensive industries for increased property values.
- Encourage property improvements and revitalization throughout the region.
- Consider annexing additional land, as necessary and as possible according to smart growth principles, to accommodate future expansion in cities.
- Discourage rural commercial and industrial development to businesses other than those businesses serving local retail, service and agricultural needs of rural communities.
- Coordinate the provision of supportive infrastructure in concurrence with new development.
- Evaluate new development impacts on existing infrastructure and services to ensure adequate capacity and compensation.
- Encourage efforts to link the region with major transportation networks.
- Work closely with public agencies, such as RTA, Jule Transit, and the private sector to
deliver an efficient and effective transportation system.
- Improve transit connections between residential communities and work sites.
- Coordinate infrastructure investment strategies of government, business, and local institutions.
- Pursue special opportunities for alternative modes of transportation to serve as attractors themselves, such as car and bicycle sharing and bicycle/pedestrian facilities and amenities.
- Limit rural commercial development oriented to the general traveling public to locations along highways or paved County roads adequate to support traffic demand.
- Foster communication with end users regarding current and future needs.
- Explore feasibility of community wide wireless computer networks, or Wi-Fi (Wireless Fidelity).
- Promote opportunities of the information superhighway for economic development.
- Maintain a computerized Geographic Information System (GIS) to support economic development in the region.
- Promote redevelopment of existing vacant, underutilized, and brownfield properties.
- Promote utilization of development-ready sites.
- Evaluate potential commercial and industrial development sites, based on the Future Land Use Maps.
- Protect development potential of commercial and industrial sites.
- Promote aeronautical and industrial park development at the Dubuque Regional Airport.
- Consider annexing growth areas, as necessary and as possible, to ensure adequate supply of developable land and to control development in the fringe areas of cities.
- Direct commercial development serving regional needs to cities able to provide needed infrastructure.
- Provide adequate customer parking when creating or expanding commercial development.
- Utilize techniques that help with traffic safety and address drainage problems.
- Protect extractive mineral and aggregate areas, whether developed or undeveloped in urban and rural areas, and reserve such areas for extractive purposes.
- Target environmentally sensitive business and industry in recruitment efforts.
- Promote development of businesses and industries that are committed to enhancing local environmental quality.
- Promote and encourage sound environment practices with existing businesses and industries.
- Promote and encourage the use of alternative and/or renewable fuel and energy sources for vehicle fleets, building operations, and manufacturing processors.
- Encourage LEED (Leadership in Energy and Environmental Design) Green Building Rating System or similar concepts in building design for new and existing facilities.
Map 7.2 - Dubuque County Employment Density
U.S. Census Bureau. 2011. OnTheMap Application. Longitudinal-Employer Household Dynamics Program. http://lehdmap.did.census.gov/
Map 7.3 - City of Asbury Employment & Outflow 2009
U.S. Census Bureau. 2011. OnTheMap Application. Longitudinal-Employer Household Dynamics Program. http://lehdmap.did.census.gov/
Map 7.4 - City of Cascade Employment & Outflow 2009
- 856 Work in Cascade, Live Outside
- 114 Live and Work in Cascade
- 777 Live in Cascade, Work Outside
| Live In | Number |
|---|---|
| Dubuque, IA | 57 |
| Dyersville, IA | 48 |
| Monticello, IA | 25 |
| Holy Cross, IA | 16 |
| Epworth, IA | 15 |
| Iowa City, IA | 15 |
| Manchester, IA | 12 |
| Worthington, IA | 12 |
| Farley, IA | 11 |
| All Others | 645 |
| Work In | Number |
|---|---|
| Dubuque, IA | 175 |
| Cedar Rapids, IA | 61 |
| Monticello, IA | 55 |
| Dyersville, IA | 54 |
| Peosta, IA | 33 |
| Anamosa, IA | 32 |
| Farley, IA | 24 |
| Davenport, IA | 22 |
| Iowa City, IA | 15 |
| All Others | 306 |
U.S. Census Bureau. 2011. OnTheMap Application. Longitudinal-Employer Household Dynamics Program. http://lehdmap.did.census.gov/
Map 7.5 - City of Dubuque Employment & Outflow 2009
- 19,208 Work in Dubuque, Live Outside
- 19,374 Live and Work in Dubuque
- 9,743 Live in Dubuque, Work Outside
| Live In | Number |
|---|---|
| Asbury, IA | 810 |
| Cedar Rapids, IA | 504 |
| Dyersville, IA | 467 |
| East Dubuque, IL | 354 |
| Davenport, IA | 329 |
| Farley, IA | 312 |
| Epworth, IA | 287 |
| Bellevue, IA | 272 |
| Des Moines, IA | 271 |
| All Others | 15,602 |
| Work In | Number |
|---|---|
| Cedar Rapids, IA | 1,067 |
| Davenport, IA | 897 |
| Peosta, IA | 392 |
| Iowa City, IA | 277 |
| Waterloo, IA | 264 |
| East Dubuque, IL | 233 |
| Des Moines, IA | 220 |
| Clinton, IA | 212 |
| Coralville, IA | 209 |
| All Others | 5,972 |
U.S. Census Bureau. 2011. OnTheMap Application. Longitudinal-Employer Household Dynamics Program. http://lehdmap.did.census.gov/
109
Map 7.6 - City of Dyersville Employment & Outflow 2009
Map 7.7 - City of Farley Employment & Outflow 2009
U.S. Census Bureau. 2011. OnTheMap Application. Longitudinal-Employer Household Dynamics Program. http://lehdmap.did.census.gov/
110
Map 7.8 - City of Epworth Employment & Outflow 2009
- 245 → Work in Epworth, Live Outside
- 13 ↻ Live and Work in Epworth
- 659 ← Live in Epworth, Work Outside
| Live In | Number |
|---|---|
| Dubuque, IA | 54 |
| Cascade, IA | 12 |
| Dyersville, IA | 10 |
| Davenport, IA | 6 |
| Farley, IA | 6 |
| Peosta, IA | 6 |
| Asbury, IA | 5 |
| Clinton, IA | 4 |
| Des Moines, IA | 3 |
| All Others | 139 |
| Work In | Number |
|---|---|
| Dubuque, IA | 287 |
| Peosta, IA | 51 |
| Farley, IA | 41 |
| Dyersville, IA | 27 |
| Cedar Rapids, IA | 25 |
| Davenport, IA | 20 |
| Cascade, IA | 15 |
| Waterloo, IA | 10 |
| Manchester, IA | 7 |
| All Others | 176 |
U.S. Census Bureau. 2011. OnTheMap Application. Longitudinal-Employer Household Dynamics Program. http://lehdmap.did.census.gov/
Map 7.9 - City of Peosta Employment & Outflow 2009
- 1,317 → Work in Peosta, Live Outside
- 21 ↻ Live and Work in Peosta
- 321 ← Live in Peosta, Work Outside
| Live In | Number |
|---|---|
| Dubuque, IA | 392 |
| Dyersville, IA | 68 |
| Farley, IA | 63 |
| Epworth, IA | 51 |
| Cascade, IA | 33 |
| Asbury, IA | 26 |
| Des Moines, IA | 19 |
| New Vienna, IA | 9 |
| Sageville, IA | 9 |
| All Others | 647 |
| Work In | Number |
|---|---|
| Dubuque, IA | 154 |
| Dyersville, IA | 19 |
| Farley, IA | 17 |
| Cedar Rapids, IA | 11 |
| Cascade, IA | 8 |
| Manchester, IA | 8 |
| Davenport, IA | 7 |
| Epworth, IA | 6 |
| Des Moines, IA | 3 |
| All Others | 88 |
U.S. Census Bureau. 2011. OnTheMap Application. Longitudinal-Employer Household Dynamics Program. http://lehdmap.did.census.gov/
Housing
Chapter 8
Housing is a basic need for all human beings, and is an important factor in community planning efforts. Housing is many homeowners' largest source of personal wealth and is usually their largest expenditure. According to the US Bureau of Labor Statistics, in 2010 housing accounted for more than 35% of consumer spending.1 Housing also affects personal behavior. Where people live affects who their friends are, where their children go to school, job opportunities, and many other aspects of daily life. Housing has a large impact on individual quality of life within the region.
Housing is one of local government’s most important issues. In urban areas, housing can account for 50% of land uses, and residential property tax revenues make up a large portion of local government budgets. Because of its high level of importance, housing affects all other planning elements listed in this plan. Public services people require, how much those services cost, and who should pay for them all depend on where, how, and at what densities people live. Of the services provided by local governments, transportation is one of the most impacted by housing. Individual travel behavior is greatly affected by where people live, and as a result, housing and transportation planning must be closely coordinated.
Housing serves an important role in the regional economy, as it affects employers’ ability to attract and retain good quality employees, and also creates jobs. If combined housing and transportation costs are too high, employers may lose employees to other regions. The housing sector also employs many workers within the region. Builders, lenders, construction workers, and real estate brokers are an important part of the regional economy.
Residential development can greatly affect the natural environment. A sustainable community needs to balance needs for new housing with environmental protections. Low impact development, conservation subdivisions, and other green building techniques can help mitigate the impact of residential development on the natural environment.
The objective of this chapter is to encourage a diverse housing stock that serves people at all income levels and at all stages of life. Good-quality housing is the foundation of a stable sustainable community. To be effective, community planning efforts, including sustainability efforts, must be integrated into a community’s housing policies.
Figure 8.1 - Dubuque County Housing Tenure
Inventory of Existing Housing
The US Census Bureau provides a wide variety of data on housing through the decennial census and the American Community Survey (ACS). The following charts are selections from the Census that depict the most important aspects of the Dubuque County housing market.
Dubuque County’s vacancy rate is lower than state and national rates. In general, the Dubuque County housing market has weathered the housing crisis better than many markets in the country where large numbers of foreclosures have driven vacancy rates up.
Dubuque County residents are more likely to own their home. According to the housing tenure data shown in Figure 8.1, renters account for 25% of the County’s occupied housing units. Nationally renters make up about 35%.
Source: 2010 American Community Survey 1-Year Estimates
Dubuque County Housing Market
When compared with the rest of the US, the Dubuque County housing market has remained relatively stable through the recent economic downturn. According to research published by the mortgage insurance firm PMI, Dubuque County was among the least risky places in the country to buy a home. PMI’s Housing Appreciation Risk Index (HARI) measures the probability that house prices will be lower in two years. According to the HARI, Dubuque County homes had a 7.6% chance of falling in the next two years. Dubuque’s score is well below the national average of 43.3% and the riskiest regions in Nevada, Arizona, Florida, and California which have HARI scores between 80% and 90%. According to PMI, “In general, the states with the lowest scores are in the Great Plains – especially North Dakota, Iowa, and Nebraska. These states did not experience large housing booms, have low unemployment and foreclosure rates, and are very affordable.”2 Figure 8.2 shows the geographic distribution of Housing Appreciation Price Risk for metropolitan areas.
Figure 8.2 - Housing Appreciation Price Risk Index
Source: PMI Mortgage Insurance Co.
2 Berson, David W. et al. “Economic and Real Estate Trends” PMI Mortgage Insurance Co. 2011, http://www.pmi-us.com/PDF/q3_11_pmi_eret.html
Housing Affordability
Housing costs as a percent of household income is a generally used measure of housing affordability. As a rule of thumb, spending less than 30% of income on housing is generally considered to be affordable. Households spending more than 30% are considered to be cost burdened and may have difficulty affording other necessities such as food, clothing, transportation, and medical care.
Figures 8.3 and 8.4 show that Dubuque County is a relatively affordable region for homeowners compared to the rest of the country and the state of Iowa. According to 2010 ACS data, 75% of Dubuque County residents with a mortgage and 89% of residents without a mortgage are paying less than 30% of their annual income towards housing.
While owner-occupied housing may be relatively affordable in Dubuque County, the same cannot be said about renter-occupied housing. Figure 8.5 shows gross rent3 as a percent of household income. The chart shows that housing affordability rates are similar to state and national rates: 48% of Dubuque County households pay 30% or more of their income towards housing.
3 Gross Rent. The amount of the contract rent plus the estimated average monthly cost of utilities (electricity, gas, and water and sewer) and fuels (oil, coal, kerosene, wood, etc.) if these are paid for by the renter (or paid for the renter by someone else).
Figure 8.3 – Monthly Owner Costs as a Percent of HH Income
Figure 8.4 – Monthly Owners Costs as a Percent of HH Income
Figure 8.5 – Gross Rent as a Percent of HH Income
Source Fig. 3-5: 2010 American Community Survey 1-Year Estimates
Combined Housing and Transportation Costs
Over the past fifty years many people have chosen to leave urban areas for rural and suburban communities as a way to reduce housing costs. For the most part, home prices are lower in suburban areas when compared to urban areas. However, in the suburban and rural areas the distance is greater between work, school, and other daily needs. The increased distance results in residents spending increased time and money on transportation. According to a report entitled Penny Wise, Pound Fuelish produced by the Center for Neighborhood Technology (CNT), the increased transportation costs associated with living in the suburbs can outweigh the savings on home costs and residents of these communities are more vulnerable to fluctuations in gas prices.4 CNT has developed a Housing and Transportation cost index (H+T Index) that allows users to compare the traditional view of affordability with the new view including transportation costs. According to the Index in all cities, many distant suburbs are less affordable than they appear. The H+T Index takes the traditional 30% of household income measure for housing and adds an additional 15% for transportation resulting in a combined affordability measure of 45%.
H+T Index results for Dubuque County are displayed in Figure 8.6. The traditional 30% affordability measure is displayed on the left and the 45% H+T threshold is displayed on the right. According to the traditional measure, 75% of Dubuque County residents are living in affordable housing. However, according to the H+T measure, 70% of residents pay more than 45% in housing and transportation costs and only 30% are paying less than 45%. The maps in Figure 8.6 display the geographic distribution of the housing cost index and the H+T index by census block. According to the H+T index, affordable areas of the county are urban areas that are close to work, school, and services and have access to public transit.
4 Penny Wise, Pound Fuelish The Center for Neighborhood Technology. March 2010, http://www.cnt.org/repository/pwpf.pdf
Figure 8.6 - Dubuque County Combined Housing Costs
Region: Dubuque, IA Region
Typical Household: Regional Median Income: $39,582 Size: 3.0 People Commuters: 1.1 Workers
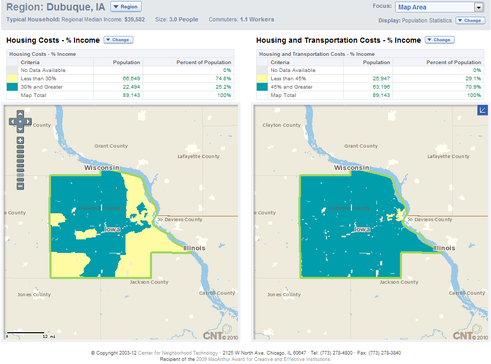
Source: Center for Neighborhood Technology, 2012.
Federal Housing Programs
The federal government has created several programs to help those individuals who are cost burdened by housing. Many of these programs operate under the US Department of Housing and Urban Development (HUD). HUD is the primary resource for housing related issues at the federal level. HUD's mission is 'to create strong, sustainable, inclusive communities and quality affordable homes for all. HUD is working to strengthen the housing market to bolster the economy and protect consumers; meet the need for quality affordable rental homes: utilize housing as a platform for improving quality of life; build inclusive and sustainable communities free from discrimination; and transform the way HUD does business.' 5
Section 8 Housing Choice Voucher
The housing choice voucher program is the federal government's major program for assisting very low-income families, the elderly, and persons with disabilities to afford decent, safe, and sanitary housing in the private market. Since housing assistance is provided on behalf of the family or individual, participants are able to find their own housing, including single-family homes, townhouses and apartments. The participant is free to choose any housing that meets the requirements of the program and is not limited to units located in subsidized housing projects.
Housing choice vouchers are administered locally by Public Housing a\Agencies (PHAs). The PHAs receive federal funds from the HUD to administer the voucher program. A family that is issued a housing voucher is responsible for finding a suitable housing unit of the family's choice where the owner agrees to rent under the program. This unit may include the family's present residence. Rental units must meet minimum standards of health and safety, as determined by the PHA. A housing subsidy is paid to the landlord directly by the PHA on behalf of the participating family. The family then pays the difference between the actual rent charged by the landlord and the amount subsidized by the program. Under certain circumstances, if authorized by the PHA, a family may use its voucher to purchase a modest home.
5 'Mission' HUD.gov. Department of Housing and Urban Development. 1 Dec. 2011 http://portal.hud.gov/hudportal/HUD?src /about/mission.
Public Housing
Public housing was established to provide decent and safe rental housing for eligible low-income families, the elderly, and persons with disabilities. Public housing comes in all sizes and types, from scattered single family houses to high-rise apartments. There are approximately 1.2 million households living in public housing units, managed by some 3,300 local Housing Agencies (HAs) nation wide. HUD administers federal aid to HAs that manage the housing for low-income residents at rents they can afford. HUD furnishes technical and professional assistance in planning, developing and managing these developments.
Dubuque County Housing Agencies
HUD works with local housing agencies to implement many of their programs. The City of Dubuque Housing and Community Development Department and the Eastern Iowa Regional Housing Authority work with HUD and the State of Iowa to assist Dubuque County residents with their housing needs.
City of Dubuque Housing and Community De -velopment Department
The City of Dubuque Housing and Community Development (HCD) Department coordinates the efforts of a number of program areas to ensure residents in the City of Dubuque receive safe and affordable housing and to provide a more livable community.
The HCD department is responsible for administering and coordinating activities relating to the use of Community Development Block Grant (CDBG) funds. Each year the City of Dubuque receives approximately $1.2 million in federal CDBG funds from HUD. The funds are used for eligible activities in the areas of housing, economic development, neighborhood and public services, public facilities, and planning/administration.
The City of Dubuque's 7,600 rental units are periodically inspected by the HCD department for compliance with the housing code and to ensure that the units provide decent and safe rental housing. Each rental unit must be annually licensed and an annual fee is charged. All owners are required to comply with these requirements. The HCD department maintains an inventory of all licensed rental units, issues license applications, and receives all fees.
116
with these requirements. The HCD department maintains an inventory of all licensed rental units, issues license applications, and receives all fees.
The Lead Hazard Reduction Program provides for the administration of a HUD funded forgivable loan for lead hazard reduction by providing financial assistance to low- and moderate-income homeowners and rental property owners to reduce or eliminate lead-based paint hazards in their properties. The program is specifically targeted to assist families with children under the age of six.
The Rental Assistance, or Section 8, Program receives federal funding to provide Housing Choice Vouchers to assist 900 households with rent payment assistance in the City of Dubuque. Individuals and families wishing to participate fill out a rental application, submit to a background check, and after approval, are issued a Housing Choice Voucher they may use at a rental unit of their choosing. If the landlord of the rental unit agrees to lease to the household under the Housing Choice Voucher Program and the unit is approved by the HCD department, then the Housing Authority will make monthly rental assistance payments to the landlord. Generally, participating households pay about 30% of their monthly adjusted income towards their rent. While receiving rental assistance, Section 8 participants have the opportunity to engage in services and programming to develop their skills and become self-sufficient.
The Shelter Plus Care (S+C) Program provides rental assistance for homeless persons with disabilities in connection with supportive services funded from sources throughout the community through other agencies and programs. The City of Dubuque has received a five-year grant from HUD to operate a Sponsor-based Rental Assistance (SRA) Program through the S+C program. The City has entered into a subcontract with a nonprofit local organization, Project Concern, to provide rental assistance, screen prospective participants, and perform assessments of clients' needs. Project Concern leases the units to be occupied by the participants.
The Homelessness Prevention and Rapid Re-Housing Program (HPRP) is to assist persons and families who are currently housed, but who are at risk of becoming homeless and may need temporary rent or utility assistance; and persons and households who are currently homeless and need temporary assistance in order to find housing and stabilize their living situation.
Eastern Iowa Regional Housing Authority (EIRHA)
EIRHA was established in 1978 to meet the housing needs of low and moderate income families and the elderly. EIRHA serves Cedar, Clinton, Delaware, Dubuque, Jackson, and Jones Counties in Eastern Iowa excluding the cities of Clinton and Dubuque. EIRHA has a contract with HUD to serve as many families as possible using their calendar year budget for Housing Assistance Payments (HAP) through the Section 8 program.
EIRHA has an annual contributions contract to assist up to 883 households, within its budget authority, with rental assistance in the region through Housing Choice Vouchers (HCV). The participating family chooses a decent, safe, and sanitary rental unit in which to reside. If the landlord agrees to lease the unit to the household under the Section 8 HCV Program, and EIRHA approves the rental unit, EIRHA will make monthly rental payments to the landlord to help the household pay their rent each month. Participating households pay a minimum of 30% of their adjusted income for rent and utilities or $50, whichever is greater.
EIRHA owns and manages 164 rental units in Dubuque, Jackson, Delaware, and Clinton Counties. These Public Housing units consist of apartments, duplexes, and single family homes that provide housing for low-income families, seniors, and persons with disabilities. Participants in the program pay a minimum of 30% of their adjusted income toward rent and utilities or $50, whichever is greater. Payments are made directly to EIRHA on the first of each month.
The Eastern Iowa Regional Housing Corporation (EIRHC) is a subsidiary of EIRHA and was established in 1990. It is organized as a not-for-profit under the provisions of Chapter 504A of the Iowa Code and serves six counties: Cedar, Clinton, Delaware, Dubuque, Jackson, and Jones Counties in Eastern Iowa. The purpose of EIRHC is to promote the general social welfare of eligible occupants of rental housing as determined by the US Department of Agriculture (USDA), Iowa Finance Authority (IFA), and Iowa Economic Development Authority (IEDA) regulations.
ulations, without regard to race, color, religion, creed, or national origin; to acquire, construct, improve, and operate any real or personal property or interest or rights. EIRHC owns and manages 10 elderly and/or disabled 1 bedroom rental units: six in Grand Mound, Iowa, and four in Worthington, Iowa. Rental assistance is financed by USDA for these units.
The Eastern Iowa Development Corporation (EIDC) is a for-profit entity and a wholly owned subsidiary of EIRHC. The EIDC was formed to serve as the general partner in all Low Income Housing Tax Credit (LIHTC) projects. The Peosta Evergreen Meadows (32 units) and Asbury Meadows (24 units) properties resulted from this formation.
Sustainable Design
To encourage a more sustainable region, the Dubuque Comprehensive Plan encourages green building strategies for residential development including: public health, energy efficiency, water conservation, smart locations, operational savings, and sustainable building practices. These strategies enhance affordable housing, community facilities, town centers, and communities as a whole.
In addition to increasing resource efficiency and reducing environmental impacts, green building strategies can yield cost savings through long-term reduction in operating expenses. The benefits include improved energy performance and comfort, a healthier indoor environment, increased durability of building components, and simplified maintenance requirements that can lead to financial efficiencies for property managers and owners. Green building practices improve the economics of managing affordable housing, community facilities, and Main Street businesses while enhancing quality of life for residents, visitors and employees. When green building practices guide the location of our buildings – placing homes, community facilities and businesses near community amenities such as public transportation to create walkable, livable neighborhoods – the benefits for citizens and communities expand to include fewer sprawl-related transportation impacts. Housing built using the green building strategies must be cost effective to build, and durable and practical to maintain. In addition, the principles work together to help produce green buildings that result in a high-quality, healthy living and working environment; lower utility costs; enhance connections to nature; protect the environment by conserving energy, water, materials and other resources; and advance the health of local and regional ecosystems.
The City of Dubuque's Green and Healthy Homes Initiative (GHHI) is designed to address home-based environmental health hazards and energy efficiency issues with integrated health, safety, lead hazards reduction, energy efficiency and weatherization interventions in low-to-moderate income homes. The City of Dubuque is currently seeking funding to implement the GHHI within the city, and planning is underway to expand the initiative to other communities within Dubuque County.
Future Needs
Senior Housing – Over the next 30 years the population of Dubuque County will continue to age. The communities of Dubuque County should plan for increased demand for extended care and assisted living facilities. Communities should also look into strategies, such as universal design and mixed-use transit-oriented development patterns that give elderly residents access to daily needs, allow them to stay in their own home, and maintain an independent lifestyle.
Low and Extremely Low Income Housing – The economic downturn has created more demand for low income housing services. Communities should continue to work with HUD and other agencies to expand homeownership opportunities, preserve existing affordable housing, and prevent homelessness.
Workforce Housing – Many households of moderate income can have difficulty getting into good quality housing. Communities should implement programs to help working families find housing that is affordable.
Rental Housing – Examination of census data has shown that while owner-occupied housing units in Dubuque County are relatively affordable when compared with the rest of the Country, the same cannot be said about rental housing. Many renters are paying upwards of 35% of their income for housing. Communities should conduct further analysis to determine the factors behind the high cost of rental housing and look into methods to improve rental housing affordability.
118
Housing + Transportation Costs – Data from the Housing + Transportation Index shows that 70% of Dubuque County residents spend more than 45% of their income on housing and transportation. The data also reveals that the most affordable areas are located within urban areas. Communities should look into methods to direct more housing towards urban areas and to help reduce transportation costs.
Goals and Objectives
- To promote the preservation, rehabilitation, and investment in our regional housing stock and neighborhoods.
- Ensure all rental housing exceeds adopted minimum housing quality standards through systematic code enforcement.
- Encourage a range of affordable, accessible, and decent rental housing options throughout the community.
- Consider expanding the use of housing preservation programs whenever appropriate and possible.
- Encourage participation in and use of low-interest rehabilitation and home purchase loan funds.
- Promote adaptive reuse of existing vacant or under-utilized structures, such as convents, schools, and industrial buildings, into housing with an affordable and/or workforce component, where appropriate.
- Encourage the expansion of the capacity of neighborhood associations.
- Promote residential educational workshops regarding restoration, rehabilitation, and maintenance.
- Encourage relocation of existing housing as opposed to demolition whenever possible; when removal is necessary, require deconstruction and landfill diversion as much as possible.
- Support the integration of new neighborhood residents into the neighborhood associations, local schools, and community activities.
- Continue to reduce vacant and abandoned housing in neighborhoods through code compliance, purchase, rehabilitation, and deconstruction if necessary.
- Promote historic preservation as the cornerstone of housing and neighborhood revitalization programs, to promote economic development and attract younger residents.
- To promote programs, education, and training that support and encourage appropriate rental housing oversight.
- Promote programs, education, and training that support and encourage appropriate landlord accountability.
- Promote programs, education, and training that support and encourage appropriate tenant accountability.
- Support Community Oriented Policing and participation of neighborhood residents in crime reduction strategies.
- To promote the creation and maintenance of an adequate supply of sound, affordable housing integrated throughout the region.
- Promote partnerships with private sector, nonprofit, other government agencies and neighborhood groups to access available public funding and attract private capital for affordable housing development.
- Promote mixed-income, mixed-rental housing developments.
- Support the Section 8 Housing Choice Voucher Program to benefit lower-income families seeking affordable rental
- housing.
- Encourage local lenders to work with all homeowners to rehabilitate, remodel, or repair existing homes.
- Develop programs and incentives that encourage property owners to maintain and improve the appearance of their property.
- Maintain the existing sound housing units and upgrade or replace all substandard housing units.
- Support the Green and Healthy Homes Initiative, providing empowerment services to households in combination with efficient rehabilitation and preservation of affordable and workforce housing.
4. To expand the opportunities for homeownership, especially for low to moderate income households.
- Encourage the use of flexible development regulations in order to assist affordable and workforce housing production and decrease housing costs.
- Encourage local lenders to participate in programs designed to assist first-time home buyers.
- Promote infill housing development opportunities, in the region's older neighborhoods, through a combination of public subsidy, affordable housing incentives and owner sweat equity.
- Promote compact and contiguous development with a variety of higher density housing options that utilize available infrastructure within the existing built environment.
- Provide housing opportunities and incentives for low and moderate income families.
- Provide financial planning for homeownership to ensure that low/moderate income households have the wherewithal to be successful.
5. To promote fair housing opportunity for residents in all neighborhoods.
- Provide for effective implementation of existing fair housing programs.
- Encourage involvement of neighborhood residents to the fullest extent possible when planning affordable housing developments.
- Monitor, evaluate, and work to minimize federal, state and local codes and regulations that are possible barriers to development of housing, particularly for persons with disabilities or low income.
6. To assist local service agencies in providing shelter and semi-independent living for persons in need of supportive services.
- Monitor and evaluate homeless and other special needs populations in order to document needs and design assistance programs.
- Provide technical assistance to agencies in preparation of applications for program funding.
- Encourage partnerships with area agencies in sponsorship of housing initiatives for special needs populations.
- Encourage development of special housing for the elderly and persons with disabilities wherever suitable sites can be made available.
7. To promote the understanding that the availability and affordability of workforce housing is an important key to successful economic development.
- Promote corporate participation in employer assisted housing, for home purchase assistance for employees.
- Encourage local institutions, i.e., hospitals, colleges, to establish replacement housing programs for housing lost to corporate expansions.
- Encourage corporate participation in the Federal Low Income Tax Credit Program, for purposes of investment in affordable housing development.
- Promote an adequate housing supply to support workforce development efforts.
- To promote the public’s awareness of housing needs and issues through informational and educational efforts.
- Consider establishing a clearinghouse of information for housing issues and information, to include providing educational programs for tenants and landlords.
- Monitor housing market conditions and availability of housing.
- Become more aggressive in attracting new residents to live in the cities.
- Promote workshops for area housing industry members (contractors, lenders, realtors) regarding changing regulatory mandates, i.e., lead-based paint, asbestos removal.
- Combat the “Not In My Back Yard,” or NIMBY, syndrome by dispelling stereotypes associated with affordable housing.
- Continue to promote collaboration with housing industry groups (Board of Realtors, Mortgage Lenders Association, Dubuque Area Landlords Association) to promote cooperation and consensus-building regarding housing issues.
- To provide housing resources for aging residents.
- Encourage the development of high-end, market-rate, and subsidized housing.
- Encourage the development of appropriate levels and styles of housing.
- Identify appropriate sites for housing development, including the style of the development and amenities to be included.
- Encourage development of affordable apartments and condominiums for retirees.
- To continue to provide appropriate infrastructure and services to neighborhoods.
- Continue incremental improvements in water, waste, and stormwater facilities.
- Continue appropriate levels of service to maintain public parks and open spaces.
Housing
- Continue to enforce parkland dedication requirements, and other developer-paid infrastructure development costs to ensure stability and equity throughout the region.
- Work with public and private utilities to ensure that broadband internet is accessible.
- To provide a variety of housing types, costs and locations in cities.
- Promote the planning, design, and construction of a wider range of housing unit types in adequate supply for all income levels and age groups.
- Encourage and promote energy efficiency in new and existing housing.
- Ensure that all new housing development is protected from potential flood hazard.
- Support the continuation of single-family development in appropriate municipal locations at similar density levels as experienced on a community wide basis.
- Discourage scattered residential development in the unincorporated portion of the County by guiding new development into a compact and compatible growth pattern within or adjacent to the incorporated area and within easily serviceable watersheds.
- Continue to encourage a wider range of housing types in the residential areas of the cities, including single-family and multi-family structures, in response to changing housing market demands.
- Continue to provide developers with appropriate levels of information and service.
- Consider developing minimum standards (height and bulk) for houses.
- Explore design guidelines for residential development.
- To provide a variety of housing opportunities within the unincorporated areas in appropriate locations.
- Ensure that the Future Land Use Development Map provides adequate development potential for a variety of housing types to meet the housing needs of present and future residents, encouraging housing to locate within incorporated communities.
- Initiate a Housing Needs Assessment Study of the County to determine current housing condition and need, and to estimate future housing requirements.
- Locate residential development in platted subdivisions with adequate public services.
- Encourage residential development to locate within existing cities and establish urban fringe development areas where adequate public services are planned or can be provided.
- Allow for the creation of urban density residential districts within established urban fringe development areas that follow the planned development process, and where urban services can be provided.
- Limit proposed non-farm residential development on lots smaller than one acre to cluster developments or conservation subdivisions that follow the planned development process, provide centralized water and wastewater systems, and have limited access.
- Investigate establishment of simplified development regulations to allow the division of "old" farmsteads from current agricultural operations, which does not create non-conformities, based upon the potential number of such divisions.
13. Increase resource efficiency, improve public health, and reduce environmental impacts by using green residential building strategies.
- Encourage water conservation strategies including but not limited to water efficient appliances and plumbing fixtures, low-water landscaping, and rain water catchment.
- Encourage energy conservation strategies including energy efficient appliances, lighting, and heating and cooling systems.
- Promote programs to improve energy efficiency and enlist the participation of utility companies in promotional efforts.
- Encourage the use of renewable energy sources.
- Promote the use of recycled building materials.
- Promote the use of building materials that do not cause negative health impacts for residents or workers.
- Encourage radon testing and abatement in residential properties.
- Encourage low impact development practices that increase stormwater infiltration rates, prevent erosion, control sediment, use land more efficiently, and require less infrastructure.
Agriculture and Natural Resources
Chapter 9
Dubuque County is located in a unique region of the Upper Mississippi River Basin known as the Driftless Area. The Driftless Area covers over 16,000 square miles in the states of Iowa, Illinois, Minnesota, and Wisconsin. The name “Driftless Area” refers to the lack of glacial drift, the silt, clay, sand, gravel, and boulders left behind by continental glaciers. The lack of glacial drift followed by thousands of years of weathering and erosion have resulted in a region of diverse topography, soils, and ecosystems. The steep and rugged landscape is referred to as karst topography. Map 9.1 displays the boundaries of the Driftless Area.
The topography of Dubuque County ranges from gently undulating in the southwest, to hilly and steep in the north and east. Along the Mississippi River and its tributaries, the topography is very steep and rugged, with high limestone bluffs and outcrops. Much of the area containing the steep terrain is heavily wooded. Map 9.2 illustrates the varying terrain across the County.
Map 9.1 - The Driftless Area
Source: The Driftless Area Initiative
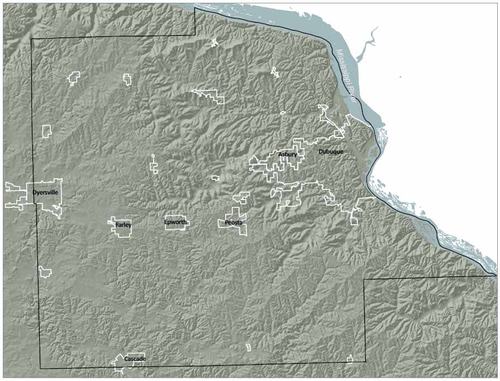
Map 9.2 - Dubuque County Topography
Source: US Geological Survey
Land Cover
The steep landscape that exists throughout much of northeast Iowa has restricted development and farming activities. Row crop production is limited in the eastern half of the county by the region’s steep topography. Farmland in the more hilly areas of the county is more likely to be used as pasture or woodland. According to the 2007 Census of Agriculture, 76% of the farmland in Dubuque County was used as cropland, while across the state, 86% of the land in farms was used as cropland. Map 9.3 shows the differences in land cover across Dubuque County.
Agriculture
Soil quality varies greatly across Dubuque County due to the uneven topography and prehistoric soil erosion. Corn Suitability Rating (CSR) is used to provide a relative ranking of soils based on their potential for row crop production. Soils with no limitations for row crop production will rate 100, while soils with severe limitations will rate 0. Map 9.4 displays the CSR for Dubuque County soils.
Agriculture and Natural Resources
Map 9.3 - Dubuque County Land Cover
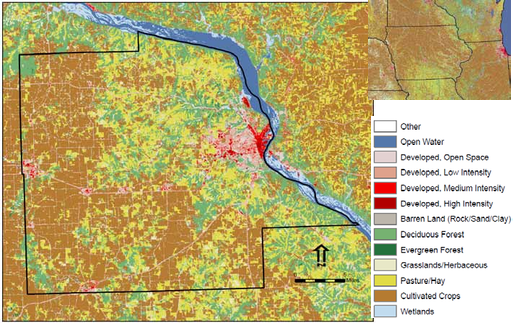
Source: US Geological Survey National Land Cover Database, 2006
Map 9.4 - Dubuque County Corn Suitability Rating
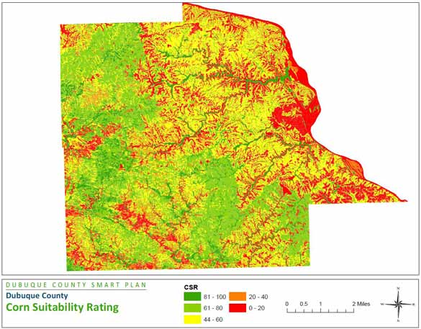
Source: U.S. Department of Agriculture, Natural Resources Conservation Service
Figure 9.1 - Average Corn & Soybean Prices
Source: Iowa State University Extension
Figure 9.2 - Historic Dubuque County Land Values
Source: Iowa State University Extension
Agricultural Economy
Agriculture is an important part of Dubuque County’s regional economy. The agricultural sector in Dubuque County employs thousands of workers and produces millions in commodity sales. Many non-farm industries such as chemical production, machinery production, and food processing link directly to the agricultural sector. Other industries with indirect links to agriculture include freight transportation and warehousing, wholesalers, and finance, insurance, and real estate services. A 2002 study conducted by Iowa State University found that every dollar’s worth of output in Iowa’s agricultural sector results in $0.63 in additional sales in the rest of the Iowa economy.1
Over the past several years the agricultural sector has fared well despite the downturn in the overall economy. According to a 2012 Food and Agricultural Policy Research Institute report, U.S. farmers earned a record net income of $98 billion in 2011.2 The primary reason for the success of the agriculture sector has been high commodity prices that have resulted from increased exports and increased ethanol consumption. Figure 9.1 shows the rise in corn and soybean prices since 2000. High commodity prices have led to an increase in land values. Figure 9.2 displays the dramatic rise in land use prices in the past five years.
1 http://www.econ.iastate.edu/sites/default/files/publications/papers/p7185-2002-12-01.pdf, 17.
2 http://www.fapri.missouri.edu/outreach/publications/2012/FAPRI_MU_Report_01_12.pdf, 62.
Agricultural Issues
Soil Erosion
Soil erosion is an important issue for agricultural producers in Dubuque County because it removes topsoil, reduces levels of organic matter, and contributes to the breakdown of soil structure. Soil erosion creates a less favorable environment for plant growth. Nutrients that are removed by erosion can no longer support plant growth, but can accumulate in water and cause problems such as algal blooms. Soils that are lost to erosion cannot be replaced, so erosion prevention is key to maintaining high agricultural soil quality. Many farmers use conservation practices to prevent erosion and maintain the quality of their land. Some of the most popular practices include:
Contour Farming – Uses crop row ridges, built by tilling and planting on the contour to create hundreds of small dams that slow water flow, increase infiltration, and reduce erosion.
Grassed Waterways – Creates a natural drainage way that is graded to form a smooth bowl-shaped channel and is seeded to sod-forming grasses. Runoff flows across the grass rather than tearing away soil and forming a gully.
Terracing – Breaks up long slopes and usually follows the contour. As water makes its way down a hill, terraces serve as small dams to intercept water and guide it to an outlet.
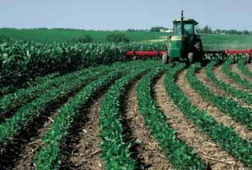
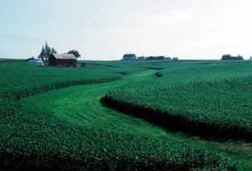
Photos Courtesy of the Dubuque Soil and Water Conservation District
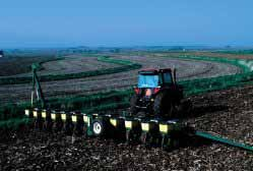
Land Development
The loss of agricultural land to non-agricultural urban and suburban development is an issue facing Dubuque County farmers. New non-agricultural buildings were most prevalent in the areas surrounding the communities of Dubuque, Asbury, and Peosta. Map 9.5 shows new the new non-agricultural building starts for Dubuque County between 2000 and 2010. The new buildings are predominantly single-family homes that are scattered across agricultural areas. This type of residential development is a concern for the agricultural industry because it can lead to the loss of productive agricultural land, increased potential for conflict between agricultural and non-agricultural land uses, and increased traffic on rural roads.
Air Quality
Because of its rural setting, Dubuque County tends to have better air quality than heavily populated urban areas. However, this is not a reason to ignore this issue. Poor air quality is unhealthy for everyone, especially children, the elderly, and people with respiratory conditions like asthma. Cleaner air requires local and regional efforts. Consortium members will need to work together and with the Iowa Department of Natural Resources (DNR) and the US Environmental Protection Agency (EPA) to create workable solutions for air quality issues.
The Federal Clean Air Act regulates six common pollutants: Coarse Particles (PM 10), Fine Particles (PM2.5), Ozone (O3), Lead (Pb), Carbon Monoxide (CO), Nitrogen Dioxide (NO2), and Sulfur Dioxide (SO2).
Map 9.5 - New Non Agricultural Building Starts 2000-2010
Source: Dubuque County Assessor, 2012 & City of Dubuque Assessor, 2012.
(SO2). The pollutants listed above are called criteria air pollutants because the EPA uses human health-based and environmentally-based criteria for setting limits on the amount of these pollutants that are permissible in the ambient air. Of the six criteria pollutants, particle pollution and ozone represent the most widespread health threats. The EPA designates areas that meet the criteria as attainment areas and areas that exceed the criteria as non-attainment areas. In addition to environmental and human health concerns, a non-attainment designation can bring many negative consequences including: increased complexity and cost of environmental permitting for public and private projects and negative perception of business considering the area for expansion.
Although Dubuque County is currently a clean air attainment area, the region's air quality is approaching EPA non-attainment levels. Currently, fine particles (PM 2.5) represent the greatest concern for the region. The EPA has set Dubuque County's PM 2.5 standard at 35 micrograms per cubic meter of air (ug/m3). The nearest PM 2.5 monitor is located 13 miles north of Dubuque in Potosi, Wisconsin. Figure 9.3 shows that between 2005 and 2008 measurements at the Potosi monitor were just under the acceptable standard. In response to the air quality data, the City of Dubuque, Dubuque Metropolitan Area Transportation Study (DMATS), the Metropolitan Planning Organization for the region, formed a clean air task force. The task force is working closely with local industry, public and private school systems, and the regional transit systems to improve the overall air quality of the region and keep PM 2.5 measurements below the threshold level.
Agriculture and Natural Resources
Water Quality
Healthy water is important to human health, but is also necessary for a great number of other reasons such as aquatic life, recreational use, wildlife habitat, economic value, and aesthetic value. Water quality is measured by various standards, but primarily involves studies concerned with excessive sediment and nutrient deposits or bacteria levels. Clean and clear waters ultimately limit aerobic bacteria, which consume dissolved oxygen. Higher dissolved oxygen levels within aquatic habitats allow for a more diverse range of aquatic life and a healthier atmosphere for the land animals (including humans) who frequent these environments.
Throughout Dubuque County, water quality changes with each watershed in the region. Fortunately, largely due to high levels of public interest in water-related recreational activities, several watersheds in the region play critical roles in protecting water quality. These efforts focus on both smaller, tribu-
Figure 9.3 - Observed PM 2.5
Potosi, WI 24 hour PM 2.5 Observations Averaged Over 3 Years
1999-2001 2000-2002 2001-2003 2002-2004 2003-2005 2004-2006 2005-2007 2006-2008 2007-2009 2008-2010 2009-2011
Data: Iowa DNR and Wisconsin DNR
tributary streams and the Mississippi River itself. It is important to gather water quality data on both small tributaries and larger streams throughout Dubuque County. Every watershed in the region flows into the Mississippi River, a river that is classified as an impaired waterbody through much of its course towards the Gulf of Mexico. The Mississippi River is the main source cause of the "dead zone" or hypoxic area in the Gulf of Mexico. The dead zone is caused by nutrient deposits from the runoff upstream into the Mississippi River, particularly the nutrients of nitrogen and phosphorous.
In order to diagnose water quality issues and devise solutions, scientific monitoring must be conducted. Monitoring water quality in the region has been done primarily through the Iowa DNR, the City of Dubuque, the Dubuque Soil and Water Conservation District (SWCD), and a volunteer citizen-based program called IOWATER. To learn more about IOWATER, view water quality data, and seek relevant information on how anyone can be involved in this community effort, visit www.iowater.net. IOWATER monitors the physical aspects of water quality and the riparian area, as well as the chemical parameters in water. These would include nitrates, nitrites, phosphorus, chloride, temperature, dissolved oxygen, pH, and bacteria.
The Catfish Creek Watershed, which flows through Dubuque County and the cities of Dubuque, Peosta, Asbury, and Centralia, has had extensive water quality monitoring done throughout the watershed. Bacteria limits are far above the 'safe' or approved IDNR standard. Nitrates and chloride are also considered to be pollutants of concern in Catfish Creek. Additional monitoring is being performed throughout the watershed, and in 2012, a Watershed Management Authority Board was formed to serve as an advisory committee to help further educate and inform community leaders and residents within the Catfish Creek Watershed.
The majority of Dubuque County residents get their drinking water from underground sources by public or private well. Therefore, protecting groundwater quality is an important environmental health issue for Dubuque County communities. Groundwater quality is especially important in the County's rural areas and small communities, as they do not have the water testing and treatment resources of larger municipal systems. Iowa officials are unsure of how many private wells deliver unsafe water. However, of the nearly 10,000 private water supply samples submitted to the State annually, approximately 40% show unsafe bacterial content and 15% to 20% exceed the maximum recommended level for nitrate in drinking water.1 There are a large number of potential ground water contaminants, but coliform bacteria and nitrates are commonly used as general indicators of water quality. Private well owners interested in testing their water quality or improving the safety of their well should contact the Dubuque County Health Department for more information.
Conservation Areas
Dubuque County maintains 16 conservation areas for public use. These properties are very diverse in both land and wildlife. The uses in these areas range from fishing, hunting, hiking, wildlife observation, educational pursuits, golfing, boating, bicycling, camping, picnicking, and much more. Along with all the activities conservation areas provide, Dubuque County takes pride in noting the special flora and fauna found in the Driftless Area.
Dubuque County is located in the Paleozoic plateau which exhibits deep valleys, high bluffs, caves, crevices, and sinkholes. The stream valleys are deep, narrow and v-shaped, exposing underlying sediment bedrock. These exposed rock formations include fossil rich Ordovician formations at the base of the hills, and Silurian formations near the tops of the hills.
The landscape of Dubuque County is one of diversity and beauty. There are canyons, deep valleys, algific slopes, remnant prairies, sprawling oaks, bogs, and much more yet to be discovered. Dubuque County hosts residents and visitors of all ages to the area to discover the greatness Dubuque County offers.
Plants and Wildlife
Dubuque County boasts several rare and threatened plant and animal species. Summers are a great time to see the beauty of the tropics in the Midwest; Cerulean Warblers, Scarlet Tanagers, Wood Thrush,
1 Glanville, Tom. "Good Wells for Safe Water" Iowa State University Extension. March 3, 1993. http://www.extension.iastate.edu/Publications/PM840.pdf
130
Ovenbirds, Bobolinks, Henslow Sparrows, Indigo Buntings, and Rufous-sided Towhees all nest here in the summer and provide a glimpse into the magic of birds. Bobcats and River Otters have been observed at Whitewater Canyon and along the Heritage Trail. Pohlman Prairie is a place to enjoy a plethora of rare butterfly species along with a beautiful remnant hilltop prairie. Along with discovering unusual plants and animals, the streams are fantastic for fishing. Dubuque boasts several cold water trout streams (some with natural reproduction), as well as smallmouth bass fishing, river access at three county parks, and at Heritage Pond, which is a great family fishing location.
Dubuque County has no shortage of rare and threatened plants: Saxifrage, Muskroot, Sullivantia, Shrubby cinquefoil, Canada yew, Monkshood, and more. There are also rare and threatened animals that live in the Dubuque area, such as the Indiana Bat, Pleistocene Snail, and Spotted Skunk. Additionally, animals of concern include the Red-shouldered Hawk, Northern Harrier, Flying Squirrel, and Bull Snakes. Invasive plant species are also a concern across Dubuque County. The most predominant invasive species are: garlic mustard, buckthorn, honeysuckle, and wild parsnip. The Dubuque County Conservation Board and several other conservation groups in the area are working towards mitigating invasive species presence in Dubuque County.
Description of Government Conservation Programs
The federal government, the State of Iowa, and Dubuque County have several different conservation programs in which landowners and/or cities can participate. These programs often provide financial assistance for conservation practices, and are listed below. For more information on a specific program, contact the Dubuque Soil and Water Conservation District (SWCD) office, located in Epworth, IA.
Federal Programs
- Conservation Reserve Program (CRP)
- Wetlands Reserve Program (WRP)
- Environmental Quality Incentives Program (EQIP)
Agriculture and Natural Resources
- Mississippi River Basin Initiative (MRBI)
Wildlife Habitat Incentive Program (WHIP)
State Programs- Conservation Cost-Sharing
- State Revolving Fund (SRF)
- Water Quality Projects
- Stormwater Best Management Practices Loan
- Resource Enhancement & Protection (REAP)
State Programs
Conservation Cost-Sharing – Fund allocations are made to Soil and Water Conservation Districts, where Commissioners set priorities for their use and field office staff assure the technical quality of those practices that are approved and built. These practices are subject to long term maintenance agreements.
State Revolving Fund (SRF) – The State Revolving Loan Fund is a source of low-cost financing available to landowners. This opportunity is available specifically to assist and encourage landowners to address and explain source pollution of Iowa streams and lakes. Applications are accepted at any time during the year, and require no cash up front. Interest rates on a revolving loan are well below other financing sources.
Water Quality Projects – Water quality protection projects protect the state’s surface and groundwater resources from point and non-point sources of contamination. Authorized under Iowa Code Chapter 161C, projects are developed through a locally led process and are initiated by Soil and Water Conservation Districts. SWCDs are responsible for coordinating the resources and programs of a variety of organizations to achieve local objectives. Project applications consider the importance of the resource to be protected, the nature and extent of the water quality concern, proposed solutions, landowner interest, and the overall cost effectiveness of the project. Water quality protection projects commonly use the watershed approach to address water quality problems. This approach involves the assessment of all possible sources that may have an effect on water quality in the project area. It provides the most comprehensive, efficient and effective way to achieve soil and water quality protection objectives. Successful projects usually have a high level of community support and include strong public information and education programs. They also feature partnerships with federal, state, and local agencies and organizations. These projects have effectively improved water quality in watersheds above publicly owned lakes, trout streams, high use recreation areas, drinking water sources, urban developments and aquifer recharge areas. Practices commonly utilized for those projects include permanent soil and water conservation practices (terraces, basins, etc.), temporary management practices (no-till, nutrient management, etc.) as well as urban erosion and storm water management practices (silt fences, bio-swales, etc.).
and water quality protection objectives. Successful projects usually have a high level of community support and include strong public information and education programs. They also feature partnerships with federal, state and local agencies and organizations. These projects have effectively improved water quality in watersheds above publicly owned lakes, trout streams, high use recreation areas, drinking water sources, urban developments and aquifer recharge areas. Practices commonly utilized for those projects include permanent soil and water conservation practices (terraces, basins, etc.), temporary management practices (no-till, nutrient management, etc.) as well as urban erosion and storm water management practices (silt fences, bio-swales, etc.)
Stormwater Best Management Practices (BMP) Loans
The Stormwater BMP Loans are a source of low-cost financing for long term / voluntary practices that manage storm water quality. This loan opportunity is available specifically to assist and encourage developers and cities to address non-point source pollution of Iowa streams and lakes through implementing stormwater quality BMPs that are included in the Iowa Stormwater Management Manual at www.ctre.iastate.edu/pubs/stormwater/index.cfm.
Resource Enhancement and Protection Program (REAP) - REAP is a state program that invests in, as its name implies, the enhancement and protection of the state’s natural and cultural resources. Iowa is blessed with a diverse array of natural and cultural resources and REAP is likewise diverse and far reaching. Depending on the individual programs, REAP provides money for projects through state agency budgets or in the form of grants. Several aspects of REAP also encourage private contributions that help accomplish program objectives. Based on a submitted proposal and allotment, REAP funds may be available for soil conservation practices through Soil and Water Conservation Districts. For more information regarding REAP visit: http://www.iowareap.com/.
Federal Programs
Conservation Reserve Program (CRP) - The Farm Service Agency (FSA) and Natural Resources Conservation Service (NRCS) administer the CRP. This program has two ways to enroll. The program cost-shares tree planting and grass establishment on highly erodible land and pays landowners an annual rental payment for up to 15 years. Although the date of the next general CRP sign-up is uncertain, there is a continuous sign-up for highly sensitive environmental areas such as riparian areas adjacent to streams and creeks, bottomland areas, and living snowfences. Through the continuous sign-up program, landowners can find out if land is eligible, what payment they will receive, and may sign up at any time. Eligible land is automatically accepted into the continuous CRP program. Under the general CRP sign-up, landowners can receive around $100 per acre land rental rate and 50% cost-share reimbursement for installation of the CRP practice. For more information on CRP visit: http://www.fsa.usda.gov/.
Wetlands Reserve Program (WRP) - Iowa landowners are interested in the WRP for both environmental and economic reasons. The primary reason for participation is economic. Continuing to farm wet or frequently flooded marginal soils gives less financial return than does a wetland easement in a U.S. Department of Agriculture (USDA) program. Also important to the farmers entering the programs are the benefits wetlands give to wildlife and water quality. Iowa's wetland restoration goal is to reestablish wetland ecosystems. Restoration activities typically include tile breaks, ditch plugs, shallow excavations, water control structures, and seedings of native grasses and forbs. Under WRP, administered by the NRCS, landowners can restore wetlands through permanent easements, a 30-year easement, or by restoring the land under a restoration cost share agreement. For more information on WRP visit: http://www.nrcs.usda.gov/programs/wrp/states/ia.html.
Environmental Quality Incentives Program (EQIP)
EQIP is a voluntary conservation program of the United States Department of Agriculture (USDA) Natural Resources Conservation Service (NRCS) that promotes agricultural production and environmental quality. This program is available to farmers and offers financial and technical assistance to install or implement structural and management practices on eligible agricultural land. Applications for EQIP can be made at local NRCS offices.
The EQIP application is based on decisions reached with producers during the conservation planning process. EQIP applications are prioritized for funding using a state or locally developed ranking worksheet that generally considers cost-effectiveness, resources to be treated, meeting national EQIP priorities, compliance with federal, state or tribal environmental regulations or reducing the need for future regulations and, to a degree, the location of the contract. Funded EQIP applications result in a contract which lists the practices to be applied along with an application schedule and federal funds committed. Conservation practices applied with EQIP funds are to be maintained for the service life of the practice, which may be longer than the term of the EQIP contract. The minimum contract length is one year after the implementation of the last scheduled practice with a maximum length of ten years. The implemented practices are subject to NRCS technical standards. Farmers may elect to use NRCS or a Technical Service Provider for EQIP technical assistance. For more information on EQIP, visit: http://www.ia.nrcs.usda.gov/programs/stateeqip.html.
with producers during the conservation planning process. EQIP applications are prioritized for funding using a state or locally developed ranking worksheet that generally considers cost-effectiveness, resources to be treated, meeting national EQIP priorities, compliance with federal, state or tribal environmental regulations or reducing the need for future regulations and, to a degree, the location of the contract. Funded EQIP applications result in a contract which lists the practices to be applied along with an application schedule and federal funds committed. Conservation practices applied with EQIP funds are to be maintained for the service life of the practice, which may be longer than the term of the EQIP contract. The minimum contract length is one year after the implementation of the last scheduled practice with a maximum length of ten years. The implemented practices are subject to NRCS technical standards. Farmers may elect to use NRCS or a Technical Service Provider for EQIP technical assistance. For more information on EQIP, visit: http://www.ia.nrcs.usda.gov/programs/stateeqip.html.
Mississippi River Basin Initiative (MRBI) - To improve the health of the Mississippi River Basin, including water quality and wildlife habitat, the NRCS is developing the Mississippi River Basin Healthy Watersheds Initiative. Through this new Initiative, NRCS and its partners will help producers in selected watersheds in the Mississippi River Basin voluntarily implement conservation practices that avoid, control, and trap nutrient runoff, improve wildlife habitat, and maintain agricultural productivity.
These improvements will be accomplished through a conservation systems approach to manage and optimize nitrogen and phosphorous within fields to minimize runoff and reduce downstream nutrient loading. NRCS will provide producers assistance with a system of practices that will control soil erosion, improve soil quality, and provide wildlife habitat while managing runoff and drainage water for improved water quality.
The Initiative will build on the past efforts of producers, NRCS, partners, and other State and Federal agencies in the 12-State Initiative area to address nutrient loading in the Mississippi River Basin. Nutrient loading contributes to both local water quality problems and the hypoxic zone in the Gulf of Mexico. The 12 participating States are Arkansas, Kentucky, Illinois, Indiana, Iowa, Louisiana, Minnesota, Mississippi, Missouri, Ohio, Tennessee, and Wisconsin.
NRCS will offer this Initiative in Fiscal Year 2010 through 2013, dedicating at least $80 million in each year. This is in addition to the agency's regular program funding in the 12 Initiative States and funding by other Federal agencies, States and partners and the contributions of producers. For more information on MRBI please visit: http://www.ia.nrcs.usda.gov/programs/MRBI.html.
Wildlife Habitat Incentive Program (WHIP)
WHIP provides cost-share reimbursement for wildlife habitat practices. A portion of Iowa's WHIP allocation will be set aside for woodland wildlife habitat improvement. WHIP will also cost-share on wildlife practices that improve grasslands, riparian corridors, shelterbelts, windbreaks, native prairie restoration, and aquatic habitat. For more information on WHIP visit: http://www.ia.nrcs.usda.gov/programs/whip.html.
Summary
Dubuque County has a diversified landscape, consisting of rolling hills and impressive bluffs, as well as high quality agricultural land composed of row crops and pasture ground. Both air quality and water quality vary across the region and are continually being monitored to improve conditions. Several different conservation programs are available through the Natural Resource Conservation Service and the Dubuque Soil and Water Conservation District to assist both cities and landowners installing conservation practices on the ground. Wildlife opportunities are abundant in Dubuque County and offer a diverse set of flora and fauna opportunities that thrive in our landscape. Preserving and restoring Dubuque County's landscape, air quality, water quality, and wildlife, while protecting our agricultural land, is an integral part of our region's natural resources.
Goals and Objectives
- To encourage the creation of a sustainable environment that successfully balances urban economic growth with the preservation of Iowa’s agricultural and natural resources.
- Encourage expansion and recruitment of environmentally conscious businesses.
- Encourage existing businesses to incorporate sustainability efforts into their operations.
- Maintain and plan for biodiverse green space as development and public improvements occur.
- Identify, preserve, and promote linkages or connections of open/green spaces.
- Promote programs and enforce ordinances that minimize soil erosion.
- Promote outdoor lighting practices that minimize light pollution.
- Encourage existing businesses and residential subdivisions to add retention basins and/or on-site infiltration systems to further control flooding and runoff.
- Promote appropriate lifestyles and infrastructure changes to reduce causes and impacts of global and local climate change.
- Identify and plan for future locations for active and passive park and recreation areas that protect natural places that are unique to Dubuque County.
- Develop more recreational trails around natural and wetland areas to preserve and utilize these areas.
- Encourage active, physical mobility (bike, walk, mass transit) to areas of daily living.
- Create and maintain urban forest inventories and plan for planting of diverse native species of trees throughout the county.
- To promote the protection, preservation, and enhancement of the region’s bluffs, prairies, wetlands, waterways, scenic views, vegetation, wildlife, and all natural areas.
- Prevent the degradation of environmentally sensitive natural resources such as stream banks, flood plains, steep slopes, slide prone areas, natural forests, wildlife habitat, areas containing shallow soils, karst areas, and endangered plants and animals.
- Promote identification, restoration, and protection of rare, native, and sensitive habitat (including prairies and woodlands), and areas that contribute to the natural character of the region with concern to the evolving understanding of expertise in current management techniques.
- Encourage protection and restoration of sensitive areas as development and redevelopment occurs, including along the riverfront bluffs.
- Encourage environmentally appropriate public use of, and access to, the region’s bluffs, wetlands, and waterways.
- Partner with community groups to demonstrate and educate the community on best management practices for sustainable design.
- Encourage reduction of non-native, invasive plant and animal species and maintain an appropriate balance of native species.
- Promote preservation of private and public lands which contribute to the area’s natural character, through connecting green belts, wildlife refuges, or passive recreational areas.
- Encourage owners of land which contains environmentally sensitive natural resources or contributes to the natural character of the region, to preserve these areas by conservation easement, lease, deed restriction, or other formal method.
- Obtain conservation easements for the preservation of agricultural land near the Mississippi River, such as the Farmland Protection Program available through the U.S. Dept. of Agriculture.
- To recognize agricultural land outside the urban fringe areas as an important natural resource of the region, and to preserve agricultural soils that have historically exhibited high crop yields and are considered most suitable for agricultural production.
- Discourage development of productive agricultural soils by nonfarm uses in the nonfringe areas.
- Before any new development is considered or advanced, numerous factors need to be considered before developing on existing agricultural land.
- Agricultural land in Dubuque County is an important natural resource and it should always be our goal to protect and preserve as much of it as possible.
- Support economic development efforts to diversify the farm economy through “value added” products, organic farming, and alternative crops and livestock.
4. Encourage farming techniques and soil conservation practices that will protect and conserve top soil and prevent degradation of water resources.
- Encourage landowners to utilize existing programs and agencies, such as the Natural Resource Conservation Service (NRCS) and the Dubuque Soil and Water Conservation District (SWCD) to install conservation practices that protect soil loss and water quality.
- Educate and inform landowners of both federal and state cost-share programs, which provide incentives for landowners to enroll in conservation programs and implement conservation practices.
- Partner with public and private organizations on watershed and conservation projects throughout the county.
- Promote the protection of wetlands, and/or sensitive areas, which play a crucial role in our local and global ecosystem.
- Encourage landowners to leave adequate buffers between agricultural land and waterways.
- Encourage landowners to not fragment land, but rather leave fencerows, timber areas, and riparian areas for wildlife and waterway protection.
5. To minimize the conflicts between agriculture and non-farm rural development.
- Discourage non-farm uses from locating outside of urban areas, or limit such uses to areas that are appropriate for the development, are least disruptive to the area’s natural character, and are designed to blend with the area’s natural character as much as possible.
- Provide appropriate transition areas between agrarian or natural areas and developing areas.
- Discourage non-farm development in agricultural areas that may hinder efficient farming practices, agricultural operations, and the ability of the agricultural community to maintain and expand agriculture activity.
- Permit agricultural services, businesses, and industries that serve the local agricultural community in rural areas if compatible with adjacent uses, and located along a road that is adequate to support projected traffic demand.
6. To promote conservation practices that result in responsible use of natural resources.
- Consider the potential for open space in any actions relative to land use.
- Promote awareness and use of alternate, renewable resources.
- Remove barriers to, explore incentives for, and encourage green building and landscaping principles.
- Promote programs to improve energy efficiency.
- Promote planting and preserving trees to reduce energy use.
- Promote walking, mass transit use, and cycling through infrastructure development to reduce energy consumption and to improve citizen and community health.
- Encourage public organizations to lead by example by purchasing and using energy and fuel efficient vehicles.
7. To educate citizens about environmental issues affecting their lives and their community.
- Partner with educational institutions and media to report status of environmental indicators trends to the community.
- Encourage ongoing environmental education programs for people of all ages, including but not limited to the human health effects of environmental issues and problems.
- Encourage coordination of community organizations concerned with environmental issues and local ecosystems.
8. To protect and preserve existing water and air quality and ensure that future water and air quality is safeguarded.
- Identify and develop measures to safeguard existing and future water and air quality.
- Ensure that all new development meets the applicable standards for water and air quality controls and investigate improvements to standards when necessary.
- Protect, control, and maintain water distribution systems to preserve water quality and meet or exceed state and federal mandates.
- Promote ground water protection and adequate water quality and quantity of our streams and rivers by expanded infiltration.
9. To assure appropriate control, collection, disposal, and reduction of stormwater, wastewater, solid wastes, and household hazardous wastes.
- Promote reduction and proper disposal of business and household hazardous waste, including purchasing alternatives.
- Promote reduction, proper collection, and disposal of solid wastes in accordance with environmental and aesthetic standards.
- Prevent toxic waste discharge into the wastewater treatment system and/or the environment through education, monitoring, and enforcement.
- Support the Dubuque Metropolitan Area Solid Waste Agency's various materials diversion programs.
- Promote a safe and sanitary environment along streets, alleys, and other properties.
- Promote implementation of best management practices in the collection and disposal of stormwater and wastewater.
- Encourage natural infiltration from rainfall and snow melt to replenish groundwater and recharge springs and aquifers.
10. To promote residential and business programs that reduce, reuse, recycle, and safely dispose of the community's discarded materials.
- Expand recycling efforts through increased participation and new materials, e.g. electronics.
- Promote use of recycled content products, e.g. compost and environmentally preferable purchasing.
- Expand food scrap and backyard composting options and awareness.
- Educate the community concerning recycling and other materials management and solid waste minimization methods.
- Promote reuse of existing buildings, deconstruction and alternative uses rather than disposal for construction/demolition materials.
11. To promote community clean-up and beautification efforts through public and private partnerships.
- Educate the public on litter prevention and illegal dumping and enforce existing laws.
- Encourage clean-up, beautification, and landscaping for the public, private, and business sectors, i.e. parkland, roadway, and shoreline adoption programs.
- Encourage plantings of native species conducive to urban native wildlife, i.e. birds and butterflies.
- Encourage community and neighborhood clean up and beautification efforts.
- Encourage balancing the advertising and identification needs of businesses, industries, institutions, and organizations with on-premise and off-premise sign regulations that protect scenic vistas, minimize sign clutter, and are consistent with local, state, and federal sign regulations.
12. To meet or exceed all federal, state, and local regulations for environmental quality.
- Gain knowledge of and promote compliance with regulations.
- Support federal and state entities in their monitoring and enforcement of their regulations.
- Enforce laws on illegal dumping and littering.
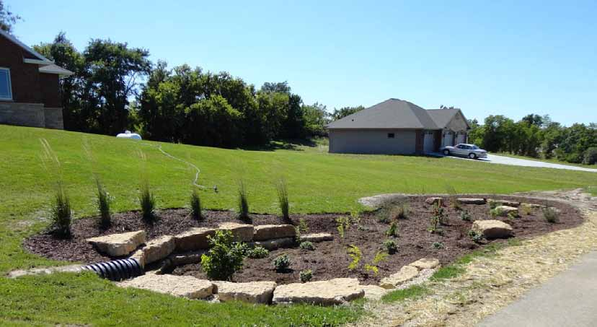
Chapter 10
Mitigation is defined as taking sustained actions to reduce or eliminate the long-term risks to people and property from hazards. An effective hazard mitigation strategy must permeate all aspects of a community. The goal of this chapter is to help com- munities exceed federal hazard mitigation planning requirements by integrating hazard mitigation into all aspects of local government operations including:
- Vision and goal setting.
- Zoning, subdivision, and building codes.
- Reviewing and preparing development agreements, redevelopment plans, and site review.
- Capital budgeting.
To achieve this goal, communities will need to ensure that all public and private stakeholders, including those outside of the public safety field, are actively engaged in the hazard mitigation process. Emergency managers, elected officials, city manag- ers, planning commission members, public works employees, transportation planners and engineers, GIS managers, environmental professionals, parks and recreation officials, and economic development directors should all be educated on hazard mitiga-
Photo Courtesy of the Dubuque Soil and Water Conservation District
tion issues and be actively engaged in the planning mitigation plans is to synthesize the information path to implementation.
process. The challenge for those developing hazard from these groups, put it into a plan, and outline a
FEMA
As part of the US Department of Homeland Secu- rity, the Federal Emergency Management Agency (FEMA) oversees and coordinates the response to disasters that go beyond the capacity of state and lo- cal governments. FEMA's mission is to support our citizens and first responders to ensure that as a na- tion we work together to build, sustain, and improve our capability to prepare for, protect against, respond to, recover from, and mitigate all hazards.
Iowa Homeland Security and Emergency Management Division
The Iowa Homeland Security and Emergency Man- agement Division (HSEMD) coordinates hazard mitigation and preparedness activities on the state level. HSEMD was created in 1965 as the State Civil Defense Agency. Following the September 11th ter- rorist attacks, the HSEMD's mission was expanded to include Iowa's homeland security efforts. HSEMD provides technical assistance, training, exercise facili-
...tation, communications and other support necessary for establishing and maintaining local capabilities. HSEMD ensures consistency and compliance with various federal and state requirements and regulations.
Dubuque County Emergency Management Agency
Local emergency management in Iowa is structured as a commission form of government established in chapter 29C of Iowa Code. County emergency management commissions are composed of a member of the board of supervisors or its appointed representative, the sheriff or the sheriff's representative, and the mayor or the mayor's representative from each city within the county. The emergency management commission establishes the agency and hires an emergency management coordinator who is responsible for the development of the countywide emergency operations plan, coordination of emergency planning activities, and providing technical assistance to communities throughout the county. The emergency management coordinator is also responsible for establishing local mutual aid arrangements, and coordinates with Iowa Homeland Security and Emergency Management to ensure the emergency management and response agencies have adequately planned and are well-equipped, trained, and exercised.
Emergency management commissions are responsible for 11 specific responsibilities. They are:
- Hazard analysis and risk assessment
- Resource management
- Planning
- Direction, control and coordination
- Damage assessment
- Communication and warning
- Operations and procedures
- Training
- Exercises
- Public education and information
- Agency administration.
County emergency management agencies are responsible for developing countywide emergency operations plans. The plans include three parts: an operations plan, a mitigation plan, and a recovery plan. The operations plan assigns responsibilities to organizations and individuals for carrying out specific actions at projected times or places during an emergency or disaster. The mitigation plan establishes interim and long-term strategies to eliminate hazards or reduce their impact. The recovery plan identifies the short-term and long-term strategic priorities, processes, vital resources, and acceptable time frames and procedures for restoration.
Emergency Management Plans
| Figure 10.1 - Emergency Management Plans and Responsible Agencies | |
|---|---|
| Plan | Agency |
| Dubuque Severe Weather Plan | Dubuque County EMA |
| Dubuque County Emergency Operations Center Plan | Dubuque County EMA |
| Dubuque County Comprehensive Emergency Management Plan | Dubuque County EMA |
| Dubuque County Mass Casualty / Mass Fatality Plan | Dubuque County EMA & Dubuque County Medical Examiner’s Office |
| Dubuque County Public Health Preparedness Plan | Dubuque County Public Health |
| City of Dubuque Evacuation Plan | City of Dubuque Police Department |
| Traffic Incident Management Plan | Dubuque County Multi-Disciplinary Safety Team & Dubuque Police Department |
| Dubuque County Winter Storm Plan | Dubuque County Engineer |
| Figure 10.1 - Emergency Management Plans and Responsible Agencies | |
|---|---|
| Plan | Agency |
| Multiple Fatality Plan | Medical Examiner’s Office |
| Dubuque County Multi Jurisdictional Hazard Mitigation Plan | Dubuque County EMA |
| Biological/Chemical Threat Agent (BCTA) Protocol | Dubuque Fire Department Hazmat Team |
| Iowa Emergency Alert System Plan | Iowa Homeland Security & National Weather Service |
| Dubuque Regional Airport Emergency Plan | Airport Operations |
| Source: Dubuque County Emergency Management Agency |
The Dubuque County Emergency Management Agency (EMA) is the primary emergency planning entity in the County, but state and federal law requires that other agencies also prepare for emergency situations. Police departments, fire departments, airports, and public health officials produce emergency plans. Figure 10.1 includes a list of the emergency management plans that are currently active in Dubuque County and the agencies responsible for producing the plans.
Cycle of Emergency Management
Mitigation is one of four phases in the cycle of emergency management. The four phases are interdependent, with each phase contributing to better performance in the next one. “Understanding of the cyclical pattern of disasters can help shape community awareness that hazards are always present, that the next disaster is a matter of time, and that mitigation planned and implemented during the lull between events can pay serious dividends in reducing future death and destruction.” Figure 10.2 illustrates the cycle of emergency management.
Figure 10.2 - The Cycle of Emergency Management
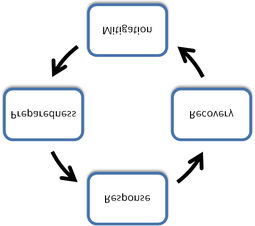
Hazard Mitigation
Mitigation. This phase includes any activities that prevent an emergency and reduce the likelihood of occurrence, or reduce the damaging effects of unavoidable hazards. Mitigation activities should be considered long before an emergency.
Preparedness. This phase includes preparations made to save lives and to help response and rescue operations. Evacuation plans, stocking food and water, and holding disaster drills are examples of preparedness. Preparedness activities take place before an emergency occurs.
Response. This phase includes actions taken to save lives and prevent further property damage in an emergency situation. During the response phase, preparedness plans are put into action. The response phase includes the mobilization of necessary emergency services and first responders to the disaster area. Response activities take place during an emergency.
Recovery. This phase includes actions taken to return to a normal or an even safer situation following
1 Schwab, James C. “Hazard Mitigation: Integrating Best Practices into Planning” American Planning Association. May 2010.
an emergency. Recovery efforts are primarily con- property, re-employment, and the repair of other es- after an emergency.
cerned with actions that involve rebuilding destroyed sential infrastructure. Recovery activities take place
The Dubuque County Multi-Jurisdictional Hazard Mitigation Plan (MJHMP) provides the basic Hazard Mitigation strategy for all municipalities in Dubuque County. In the past, each incorporated city and county in Iowa was required to complete their own hazard mitigation plan, but regulations were recently changed requiring that all municipalities within a county be included in a multi-jurisdictional plan.
The Disaster Mitigation Act of 2000 requires all local governments to assess their risks to natural hazards and identify actions that can be taken in advance to reduce future losses. The law requires all local governments and districts to have an approved Multi Hazard Mitigation Plan to be eligible for federal disaster assistance and hazard mitigation funding programs.
To assist Dubuque County in the preparation of the mitigation plan, HSEMD awarded a contract to Dubuque County who in turn contracted with East Central Intergovernmental Association (ECIA). ECIA's role was to assist Dubuque County with the completion of a FEMA-approved multi-jurisdictional local hazard mitigation plan. The Dubuque County MJHMP was last updated in 2012.
Analysis Hazards and Risks
The primary purpose of the MJHMP is to identify hazards, analyze the risk associated with each hazard, and estimate the community's vulnerability to each hazard. Hazards are ranked using the Hazard Risk Analysis Ranking system. The system awards a score of 1-4 for each of the following categories: Historical Occurrence, Probability, Vulnerability, Maximum Geographic Extent, Severity, and Speed of Onset. The scores are summed and hazards are ranked based on their total score, which can range between 6 and 24. Hazard rankings are done in two groups, countywide hazards and community specific hazards. Figure 10.3 shows the results of the countywide ranking.
| Figure 10.3 - Hazard Analysis Risk Assessment Results For Countywide Hazards | ||
|---|---|---|
| Hazard | Total Score | Rank |
| Severe Winter Storm | 21 | 1 |
| Windstorm | 18 | 2 |
| Thunderstorm &Lightning | 17 | 3 |
| Extreme Heat | 15 | 4 |
| Tornado | 15 | 5 |
| Hailstorm | 15 | 6 |
| Drought | 14 | 7 |
| Grass or Wild Land Fires | 9 | 8 |
Maximum Geographic Extent, Severity, and Speed ranked based on their total score, which can range groups, countywide hazards and community specific wide ranking.
of Onset. The scores are summed and hazards are between 6 and 24. Hazard rankings are done in two hazards. Figure 10.3 shows the results of the county-
Once each of the eight identified countywide hazards have been assessed, scored, and ranked, the eight hazards are prioritized into one of three categories to provide guidance in the establishment of goals, objectives, timetables and mitigation alternatives. The
| Figure 10.4 - Hazard Priority Lists for County- wide Hazards | ||
|---|---|---|
| Priority Group 1 | Priority Group 2 | Priority Group 3 |
| Severe Winter Storm | Hailstorm | Drought |
| Windstorm | Grass or Wild Land Fire | |
| Thunderstorm &Lightning | ||
| Extreme Heat | ||
| Tornado |
| City | Dam Failure | Flash Flood | Landslide | Levee Failure | River Flood | Sinkholes |
|---|---|---|---|---|---|---|
| Uninc. Co. | UNL | 19 | 10 | UNL | 13 | 9 |
| Asbury | UNL | 9 | UNL | UNL | UNL | UNL |
| Balltown | UNL | UNL | UNL | UNL | UNL | UNL |
| Bankston | UNL | 12 | UNL | UNL | UNL | 10 |
| Bernard | UNL | 15 | UNL | UNL | UNL | UNL |
| Cascade | UNL | 13 | UNL | 19 | 10 | UNL |
| Centralia | UNL | 10 | UNL | UNL | UNL | UNL |
| Dubuque | 9 | 17 | 11 | 15 | 16 | 9 |
| Durango | UNL | 24 | UNL | UNL | 24 | UNL |
| Dyersville | UNL | 20 | UNL | UNL | 18 | UNL |
| Epworth | UNL | 17 | UNL | UNL | UNL | 12 |
| Farley | UNL | 16 | UNL | UNL | UNL | UNL |
| Graf | UNL | 16 | UNL | UNL | UNL | UNL |
| Holy Cross | UNL | UNL | UNL | UNL | UNL | UNL |
| Luxemburg | UNL | 15 | UNL | UNL | UNL | UNL |
| New Vienna | UNL | 14 | UNL | UNL | 6 | UNL |
| Peosta | UNL | 19 | UNL | UNL | UNL | UNL |
| Rickardsville | UNL | 13 | UNL | UNL | UNL | UNL |
| Sageville | UNL | 24 | UNL | UNL | 24 | UNL |
| Sherrill | UNL | 14 | UNL | UNL | UNL | UNL |
| Worthington | UNL | 13 | UNL | UNL | 20 | UNL |
| Zwingle | UNL | UNL | UNL | UNL | UNL | UNL |
UNL – Unlikely to Occur
Priority Group 1 Hazards are candidates for immediate focus in the emergency plan because of their high risk. Priority Group 2 hazards are those that have a known risk, but their focus in the plan will have mitigation activities in the next 1-3 years. Those noted in Priority Group 3 have an acceptable level of risk and will not be addressed further. No action items were formulated to address Group 3 hazards. Countywide Hazard Priorities are listed in Figure 10.4.
Each participating jurisdiction independently ranked the six hazards that are considered to vary from city to city. The six community specific hazards are: dam failure, flash flood, landslide, levee failure, river flood and sinkholes. In Figure 10.5, the six hazards are identified with their risk analysis score on a scale of 6–24, or with a UNL for unlikely to occur. Some cities found that their risk is only to county-wide hazards and not to the six hazards considered to be site-specific. The hazards were ranked as either "unlikely to occur" (UNL) or given numerical scores using the Hazard Risk Analysis Ranking system.
Hazard Mitigation
Hazard Descriptions
The following section contains a brief description of severe winter storms, flooding, and severe storms. These three hazards were ranked high in the countywide and community specific Hazard Analysis Risk Assessment. The Dubuque County MJHMP contains a more detailed description of each hazard.
Severe Winter Storm
Overall vulnerability to severe winter storms relative to other hazards is considered high, with significant potential impact to the general population and/or built environment and significant exposure of assets. Winter storms typically involve snow and ice, occasionally accompanied by high winds, which can cause downed trees and power lines, power outages, accidents, and road closures. Transportation networks, communications, and utilities infrastructure are the most vulnerable physical assets in the planning area and affect the jurisdiction equally. The most significant damage during winter storm events occurs when freezing rain and drizzle accumulates on utility poles and power lines, causing widespread power outages.
141
works, communications, and utilities infrastructure are the most vulnerable physical assets in the planning area and affect the jurisdiction equally. The most significant damage during winter storm events occurs when freezing rain and drizzle accumulates on utility poles and power lines, causing widespread power outages.
During heavy snow and ice events, the threat to public safety is typically the greatest concern. Lower income and elderly populations are more at risk in cases of power outages during severe winter storms. These storms also impact the local economy by disrupting transportation, school and commercial activities. Travelers on roadways and highways in Dubuque County, particularly along remote stretches of road, can become stranded, requiring search and rescue assistance and shelter provisions. Agriculture and livestock are also vulnerable to extreme cold temperatures and heavy snow.
Buildings that have tree limbs hanging over them are more vulnerable to damage by falling limbs. Utility power poles and lines are the critical facilities that are most vulnerable. Potential losses to the electric line infrastructure are difficult to quantify. Roads and bridges covered with ice make travel treacherous and slow emergency vehicles. Businesses experience losses as a result of closure during power outages. Schools also often must close.
Winter Storm Mitigation and Preparedness
Although future residential or commercial buildings built to code should be able to withstand snow and ice loads from severe winter storms, the increased number of developments will place additional demands for utility infrastructure on the current systems. The MJHMP recommends investment in utility infrastructure, including burial of electric utilities and the addition of poles in areas prone to ice accumulation. Some communities in Dubuque County are now deploying GPS technology as part of their snow and ice removal strategy. GPS locators are placed in snow plow trucks and can be linked to the city's GIS system. The GPS improves efficiency of snow removal service, and helps keep employees safe by monitoring their location. These actions should decrease future losses.
Flash and River Flooding
Floods are among the most frequent and costly natural disasters in terms of human hardship and economic loss. Eastern Iowa has experienced numerous flood events and loss of millions of dollars in property and crop damage over the past 25 years.
There are several different types of potential flood events in Dubuque County including river and flash flooding. Flash flooding can best be characterized as an event occurring with little or no warning time where water levels rise at an extremely fast rate. Flash flooding results from intense rainfall over a brief period, sometimes combined with rapid snowmelt, ice jam release, frozen ground, saturated soil, or impermeable surfaces.
Flooding caused by rivers, creeks and other tributaries overtopping their banks due to large amounts of precipitation, was also identified as being a risk to several of the Dubuque County jurisdictions. Summer floods result from above normal precipitation over an extended period of time and/or extremely heavy rainfall. Spring floods typically result from the rapidly melting of snow and rain. River floods are typically forecast well in advance, but in some cases, residents may have as little as 24 hours warning. Damages from river floods may include any property as heavy rains of this magnitude create heavy ground saturation and commonly flood basements. Depending on the month and maturity of crops, they may cause significant crop damages as well.
Historically, the Mississippi River has flooded the City of Dubuque's low-lying riverfront properties many times over the last 150 years. Since 1973, a 6.4 mile long earthen and concrete floodwall system has protected Dubuque from numerous Mississippi River flood events. Those flood events include four of the ten highest flood crests ever measured, including Dubuque's second highest ever crest of 25.40 feet in 2001. Only Dubuque's Chaplain Schmitt Island and Catfish Creek valley lie outside the protection of Dubuque's floodwall. See Maps 10.1 - 10.8 at the end of the chapter for flood risk maps for Dubuque County and individual cities.
In July 2010, Dubuque County experienced severe flooding. The City of Durango reported heavy downpours, thunder and lightning. Water came over U.S.
52 and the worst came from the north, from the area of the City of Sherrill and 'raged' down U.S. 52. As water came over the highway, it poured into doors and into homes. Twelve homes in Durango were impacted, and several are considering FEMA buyouts.
The City of Dyersville has a long history of dealing with flash and river flood events. In 2009, the City of Dyersville was awarded $3,336,800 through the Hazard Mitigation Grant Program which has provided the City with the funding to acquire 27 properties that have severe flood damage. To date, 11 of the properties have been acquired and the process continues. In 2009 the City was also awarded a Community Development Block Grant in the amount of $1,100,000 for the acquisition of an additional 10 properties. That process also continues and is expected to be completed by Fall 2012.
Flooding Mitigation and Preparedness
Communities can help reduce flooding by implementing Low Impact Development (LID) techniques. LID techniques focus on maintaining predevelopment hydrologic conditions by managing runoff at the source using uniformly distributed stormwater management facilities. Instead of conveying and treating stormwater in large facilities located at the bottom of drainage areas, LID addresses stormwater through small, cost-effective landscape features located at the lot level. Examples of LID techniques include limiting impervious surfaces and avoiding sensitive areas. For more information on LID see the Watershed Planning chapter.
Communities can also help mitigate flood damage by limiting development in the floodplain. The risk of flooding to future development in Dubuque County should be minimized by the floodplain management programs in the region. Many Dubuque County communities have chosen to participate in the National Flood Insurance Program (NFIP). Communities across the United States participate in the NFIP by adopting and enforcing floodplain management ordinances to reduce future flood damage. In exchange, the NFIP makes federally backed flood insurance available to homeowners, renters, and business owners in these communities. Flood risk can be further reduced by strengthening floodplain ordinances beyond minimum NFIP requirements.
Hazard Mitigation
Other mitigation actions include elevation of structures in the hazard path; acquisition of structures in the hazard path; raising, grading, or resurfacing roads, reinforcing culverts to counteract washouts; and adding lift stations. Some communities in Dubuque County have portable Hesco barriers that are filled with sand and can be deployed to protect property and vital infrastructure during a flood.
Severe Storms
Thunderstorms, lightning, tornado, hailstorms, and windstorms are relatively common in Iowa, including Dubuque County, particularly in the spring and summer. All areas of Dubuque County are vulnerable to severe storms. Most severe storms cause little damage, but some can be life threatening and cause extensive damage to buildings, trees, utilities, and crops. Tornadoes are relatively common in Iowa, including Dubuque County, particularly in spring and summer. The potential for tornadoes to occur is county-wide. Iowa has higher rate of tornadoes per square mile than any other state. Lightning can cause damage to electronic equipment located inside buildings. Communications equipment and warning transmitters and receivers could be knocked out by lightning strikes. Hail can cause significant damage to buildings, utilities, and crops.
Severe Storm Mitigation and Preparedness
Severe storms affect the entire planning region, including all above ground structures and utilities. Future development projects should consider severe storm hazards at the planning, engineering and architectural design stage with the goal of reducing vulnerability. Many Dubuque County communities already have development and building codes that address severe storm mitigation. Storm warning systems are effective method to prepare for severe storms. Warning systems can be as simple as encouraging citizens to purchase NOAA weather radios, but can also include television audio and video overrides as well as outdoor warning sirens. Any warning system should have a plan for how and when it is used and how it is maintained and tested.
Man-made Disasters
Man-made disasters result from hazards that have an element of human intent, negligence, or error; or involve the failure of a man-made system. Examples of man-made hazards include technological hazards such as structural collapse, industrial hazards, hazardous material spill, and power outage. Man-made hazards can also be caused by societal problems that result in war, terrorism, and rioting. Transportation is also a source of man-made hazards. Aviation, rail, and road disasters can result in loss of life, property damage, and long term impacts on mobility within a region.
143
involve the failure of a man-made system. Examples of man-made hazards include technological hazards such as structural collapse, industrial hazards, hazardous material spill, and power outage. Man-made hazards can also be caused by societal problems that result in war, terrorism, and rioting. Transportation is also a source of man-made hazards. Aviation, rail, and road disasters can result in loss of life, property damage, and long term impacts on mobility within a region.
In Dubuque County transportation represents a potential man-made hazard. US highways 20, 52, 61, and 151 and the CN and CP railways are important regional commerce routes that can also pose some risk for accidents that produce chemical spills, fire, and explosions. The highways also represent important evacuation routes that need to remain open during an emergency. The region also has many bridges. The heavily traveled US 61/151 bridge and the Julien Dubuque Bridge need to be inspected and maintained regularly. Other potential man-made hazards in Dubuque County include levee failure, industrial accidents, and fires.
Man-made Disaster Mitigation and Preparedness
Mitigation and preparedness activities or man-made disasters can differ based on the type of disaster. Many man-made disasters, such as the 2007 I-35W bridge collapse in Minneapolis, are the result of flaws in design, maintenance, and construction without any assistance from the natural environment. The best strategy to prevent these types of disasters is to make infrastructure inspection and maintenance a top community priority. Communities can do this by including projects recommended in hazard mitigation plans in their capital improvement plans. If the infrastructure is not under the community's direct control, the community will need to work with other government agencies, such as the Iowa DOT, or private companies, such as gas pipeline operators, to ensure that proper inspection and maintenance are completed.
In other cases, structures in normally good condition are pushed beyond their limits by unusual events, such as the railroad bridge collapse in Cedar Rapids during the flood of 2008. Regular inspection and maintenance can limit weaknesses and make structures more resilient to these events, but it is impossible to design a structure that will withstand every possible event. In these cases, it is important for communities to develop contingency plans so that the community can continue to function during a disaster. The Dubuque County Multi-Disciplinary Safety Team with local law enforcement and the City of Dubuque maintain local evacuation and incident management plans. The evacuation plan lists primary evacuation routes and secondary routes that are to be used if a primary route becomes impassible. The incident management manual outlines a program designed to aid agencies in rerouting traffic in the event of a road closure. Both plans should be reviewed and updated to keep the region prepared for a disaster.
Information technology and communications systems are an important consideration for disaster preparedness. If a municipal building is destroyed or power is lost, thousands of important documents and other data can be lost. Communities in Dubuque County can protect their information by locating facilities outside of the flood plain, installing battery backup systems and emergency generators, and using offsite storage. Good communications are important to emergency response especially during a disaster. Dispatch systems should be protected and redundant so service can remain online during a disaster. Communities should also work with nearby municipalities to ensure that their communications systems are compatible so communications can be maintained during emergency response.
Implementation
The goals, actions, and timelines will be discussed with directions given by the Board of Supervisors, City Councils, Mayors, and School District Superintendents for inclusion of these mitigation measures into their budgets for implementation. The region will continue to include mitigation projects in capital improvements plans and comprehensive land use plans for implementation on a planned basis whenever feasible. Land use decisions will incorporate the findings of the MJHM Plan. Figure 10.6 includes a list of the top three hazard mitigation priorities for each community. A complete list of projects can be found in the Dubuque County MJHMP.
Hazard Mitigation
| Figure 10.6 - Top Hazard Mitigation Priorities | ||||
|---|---|---|---|---|
| Rank | Mitigation Action | Estimated Cost | Completion Date | Participating Jurisdictions |
| All Jurisdictions | ||||
| 1 | Continue to add needed infrastructure to mitigate flood damage. | Unknown | Ongoing | ALL |
| 2 | Train personnel as weather spotters. | Staff Time | Ongoing | ALL |
| 3 | Maintain or consider NFIP membership as required. | Unknown | Ongoing | ALL |
| Dubuque County | ||||
| 1 | Develop Emergency Alert Notification Systems for vulnerable unincorporated areas of Dubuque County (i.e. text alert, email, voice recording, etc.) to notify residents of pending/possible disasters. | Unknown | Long Term | UC/EMC, CSO |
| 2 | Continue to enforce the Floodplain Ordinances and monitor all construction activities that are located in or near a floodplain. | $5,000 | Ongoing | UC/Zoning |
| 3 | Maintain an evacuation plan as referenced out of the Comprehensive Emergency Management Plan (CEMP). | $1,000 | Ongoing | UC/CSO, EMC |
| Asbury | ||||
| 1 | Continue to use City Hall as a storm shelter and to consider the building of a safe room in conjunction with any new city building projects for the safety of current and future Asbury citizens. | NA | Ongoing | Asbury/City Council |
| 2 | Continue to make the Fire Station available as a shelter space to persons in need on a temporary basis during periods of extreme heat. | NA | Ongoing | Asbury/Fire Dept |
| 3 | Continue to keep all seven backup generators in good repair and available. | $12,600/yr | Ongoing | Asbury/Public Works |
| Figure 10.6 - Top Hazard Mitigation Priorities | ||||
|---|---|---|---|---|
| Rank | Mitigation Action | Estimated Cost | Completion Date | Participating Jurisdictions |
| Cascade | ||||
| 1 | Install electrical distribution lines underground. | $0 | Ongoing | Cascade/Public Works Director |
| 2 | Secure and place two new outdoor weather warning sirens to be strategically placed in the community. | $38,000 | Ongoing | Cascade/City Administrator |
| 3 | Continue to maintain and operate current outdoor weather warning system. | $2,500 | Ongoing | Cascade/Public Works Director |
| Dubuque | ||||
| 1 | Continue to maintain and update City's severe weather plan and winter weather plan on an annual basis. | $1,000/ Annually | Ongoing | Dubuque/ EMA/ Public Works |
| 2 | Continue to remove snow and ice from City streets, airport parking and City-owned parking lots per the snow and ice control plans. | $1.25 million annually | Ongoing | Dubuque/ Public Works/ Airport |
| 3 | Continue maintenance review and enforcement of snow removal regulations and updating the ordinance regarding on-street parking following a snow event. | $2,000/ Annually | Ongoing | Dubuque/ Public Works/ Police/ Parking |
| Dyersville | ||||
| 1 | Project Ranking Incomplete | |||
| 2 | ||||
| 3 | ||||
| Epworth | ||||
| 1 | Oversee completion of 2 storm water studies to examine concerns in the northwest and southwest quadrants of the city. | $30-$40K | Short Term | Epworth/ Mayor & City Clerk |
| 2 | Implement mitigation actions recommended as result of storm water studies. | Unknown | Long Term | Epworth/ Mayor & City Council |
| 3 | Evaluate generator needs for mobility to service lift station. | $9,000 | Short Term | Epworth/ Public Works |
Hazard Mitigation
| Figure 10.6 - Top Hazard Mitigation Priorities | ||||
|---|---|---|---|---|
| Rank | Mitigation Action | Estimated Cost | Completion Date | Participating Jurisdictions |
| Farley | ||||
| 1 | Upgrade city storm sewer system to prevent future residential, business and city infrastructure flood damage. | $500,000 | Long Term | Farley/Public Works |
| 2 | Protect Waste Water Treatment Center from flooding by developing a retention/detention area to the SW of the WWTP. Create a retention/detention area to the SE of the WWTP with a bypass storm water pipe. | $100,000 | Long Term | Farley/Public Works |
| 3 | Purchase and install a tornado warning siren in northeast section of city near school and park. | $7,500 | Short Term | Farley/Mayor & CC |
| Peosta | ||||
| 1 | Provide storm drainage between Tennis Lane and Kapp Drive. | $50,000 | Sept. 2012 | Peosta/PW/City Council |
| 2 | Continue to participate in the 28E Agreement with the City of Peosta and Centralia/Peosta Fire Department for fire protection. | $0 | Ongoing | Peosta/City Council/Fire Department |
| 3 | Install Knox Boxes for all industrial and commercial buildings including schools. | $5,000 | Ongoing | Peosta/City Council/Fire Dept. |
Goals and Objectives
- Increase capabilities within Dubuque County entities to mitigate the effects of hazards by enhancing existing or designing and adopting new policies that will reduce the damaging effects of hazards.
- Reduce repetitive property losses due to flood, wildfire, winter storms, and other hazards.
- Protect critical facilities, infrastructure, and utility systems.
- Encourage the incorporation of mitigation measures into repairs, redevelopment, and capital improvement projects for governments, businesses, educational institutions, and the public.
- Identify funding opportunities for future mitigation measures.
- Protect the most vulnerable populations, buildings, and critical facilities within Dubuque County through the implementation of cost effective and technically feasible mitigation projects.
- Educate property and business owners on affordable mitigation and preparedness measures that can be taken to reduce property loss.
- Assure that vulnerable buildings and critical facilities within Dubuque County are identified and cataloged, and that vulnerability assessments are completed for each identified facility.
- Assure that vulnerable populations such as the elderly, homeless, low income or those with limited English proficiency are included in educational programs regarding preparedness or mitigation.
- Enhance the capabilities to collect, analyze, update, and exchange data and information to support risk assessment and mitigation needs.
- Improve the level of responder, government, business, and citizen awareness and preparedness for disaster.
- Identify and develop needed training and exercises for targeted responder, government and citizen audiences.
- Strengthen outreach and partnerships with the private sector, nonprofit organizations and the public.
- Improve public understanding of hazards and risk by providing public awareness, preparedness, and mitigation information through various channels of communication.
- Develop programs to assure that response agencies, governments, educational institutions, and local businesses are able to operate during times of disaster.
- Promote the development of emergency response plans, including continuity of operations plans, among local response agencies, governments, educational institutions and local businesses.
- Provide education, training, and exercise opportunities for local entities to prepare for and test their ability to operate during times of disaster.
- Coordinate a multi-jurisdictional approach to integrate hazard mitigation and land use planning.
- Create maps to identify hazardous areas.
- Incorporate hazard mitigation into zoning, subdivision, and building codes where applicable.
- Develop policies and ordinances to steer development away from hazardous areas.
- Review land for potential hazards before subdivision approval.
- Consider providing incentives for building in non-hazardous areas.
- Preserve and enhance protective features of the natural environment including wetlands, vegetation on steep slopes, and other natural areas that promote ground water infiltration.
- Retrofit buildings and facilities at risk in redeveloping areas.
6. Coordinate future transportation plans with appropriate hazard mitigation plans including the Regional Evacuation Plan and the Incident Management Manual.
- Prioritize which roads and bridges that shall remain passable during an emergency or evacuation.
- Identify alternative routes if prioritized roads and bridges become impassible.
- Train all personnel in emergency response procedures and protocols, and conduct annual refresher training.
- Establish ongoing means of redundant communication with fire, sheriff, and police departments and the County Emergency Management Agency to ensure sharing of crime and security information among all concerned.
- Work with public safety agencies including law enforcement, fire, emergency medical services, and emergency management regarding security and emergency preparedness plans.
- Define transit system’s role in non-transit emergencies.
- Review evacuation plans in the region, focusing on transit security plans.
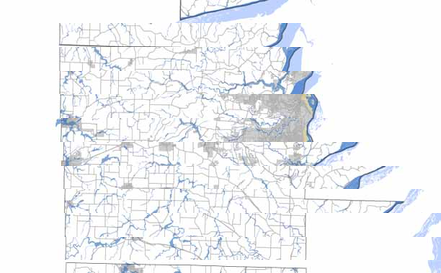
Data: Dubuque County, 2012
Flood Data: FEMA DFIRM Maps, 2012
Map Prepared by ECIA, 2012
1% Annual Chance of Flooding
0.2% Annual Chance of Flooding
Protected by Levee
23 U.S. Highway
9 State Highway
X47 County Road
Data: Dubuque County, 2012
Flood Data: FEMA DFIRM Maps, 2012
Map Created by ECIA, 2012
1% Annual Chance of Flooding
0.2% Annual Chance of Flooding
23 U.S. Highway
9 State Highway
X47 County Road
Map 10.3 - City of Cascade Flood Risk
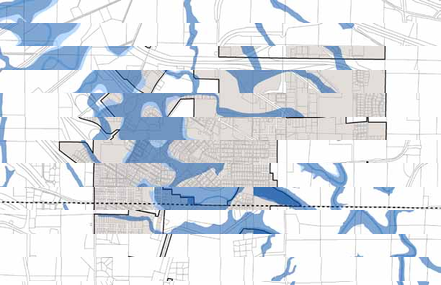
Map 10.4 - City of Dubuque Flood Risk
Map 10.5 - City of Dyersville Flood Risk
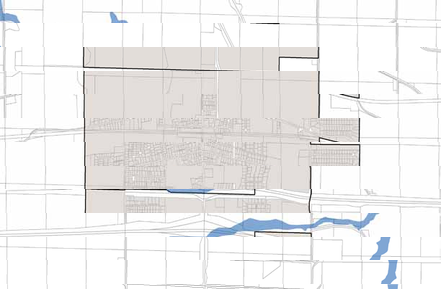
Map 10.6 - City of Epworth Flood Risk
Map 10.7 - City of Farley Flood Risk
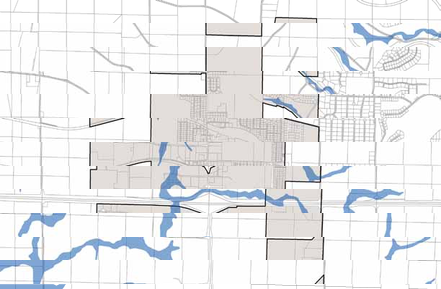
Map 10.8 - City of Peosta Flood Risk
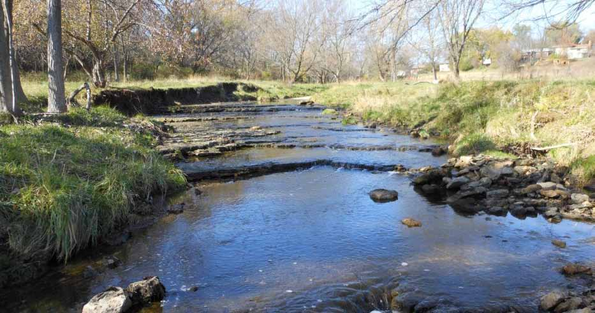
Management
Chapter 11
Dubuque County watersheds are in a state of constant change. Land use changes, agricultural farming practices, and urban development have produced habitat alteration and a drastic increase in the rate and volume of stormwater inputs. Understanding the importance of land use planning, the impacts of infiltration-based practices, and developing site-specific boundaries of non-point source pollution within a watershed will lead to improvements in our local watersheds. Maps 11.1–11.8 at the end of the chapter show the Region's watershed boundaries. One of the goals of this plan is to work towards repairing the damage done to in-stream habitat and reduce the rate and volume of stormwater flow using infiltration-based practices.
The Hydrologic Cycle
The hydrologic cycle, illustrated in Figure 11.1, is the movement of water from the atmosphere to the earth's surface. Water moves through one or more components of the cycle including evaporation, transpiration, runoff, precipitation, infiltration, percolation, and its eventual return to the atmosphere. In an undeveloped area, with natural ground cover such as forest or meadow, a significant portion of precipitation infiltrates into the soil. This water is filtered and cooled as it travels underground. Some infiltrated water is subsequently discharged into rivers and streams as baseflow. Baseflow provides a steady contribution of high quality water to lakes, streams, and rivers. Other infiltrated water descends deeper underground to the water table and recharges aquifers. Groundwater recharge replenishes the supply of underground water that can be extracted for domestic use and irrigation. Another portion of precipitation is returned to the atmosphere through a combination of evaporation and plant transpiration called evapotranspiration. Where there is natural ground cover, all of these processes together serve to minimize the percentage of precipitation that becomes runoff, the water that flows over that land surface into streams and other surface water bodies.
Photo Courtesy of the Catfish Creek Watershed Management Authority
Figure 11.1 - The Hydrologic Cycle
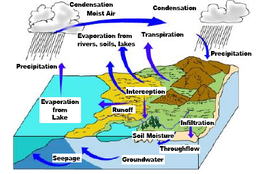
Adapted from: The Physical Environment: An Introduction to Physical Geography
Urbanization dramatically affects the hydrologic cycle by altering the relative percentage of precipitation that contributes to groundwater, evapotranspiration, and runoff relative to the natural ground cover. Specifically, urbanization increases runoff by decreasing the amount of water that infiltrates into the ground and is taken up and transpired by plants. This is because water cannot infiltrate into, and plants cannot grow on, impervious surfaces such as pavement and rooftops. Figure 11.2 illustrates how watershed imperviousness affects the magnitude of each of the hydrologic cycle components. Increased stormwater runoff not only decreases baseflow and groundwater recharge, but also increases the amount of water that runs off the surface, picking up and carrying pollutants to lakes, streams, rivers and wetlands. The increased surface runoff increases flooding frequency and severity while the increased input of pollutants degrades water quality and aquatic habitat.
Establishing countywide standards for the quantity and quality of water that runs off land under construction in urban and rural areas, including farms will play a crucial role in protecting our watersheds in Dubuque County. Providing flexibility in meeting those standards, and recognizing the unique characteristics of each project site, will be equally as important.
Construction site erosion and uncontrolled stormwater runoff from land disturbing and land development activities have significant adverse effects upon regional water resources including the health, safety, property and general welfare of the community, diminishing the public enjoyment and use of natural resources. Effective erosion control, sediment and stormwater management depends on proper planning, design, timely installation and continued maintenance of erosion control and stormwater management practices. Specifically, soil erosion and stormwater runoff can:
Watershed Management
- Carry sediment, nutrients, pathogens, organic matter, heavy metals, toxins and other pollutants to regional lakes, streams and wetlands;
- Diminish the capacity of water resources to support recreational and water supply uses and a natural diversity of plant and animal life;
- Clog existing storm drainage systems, increasing maintenance problems and costs;
- Cause bank and channel erosion;
- Increase downstream flooding;
- Reduce groundwater recharge, which may diminish stream base flows and lower water levels in regional lakes, ponds and wetlands;
- Contaminate drinking water supplies;
- Increase risk of property damage and personal injury, and;
- Cause damage to agricultural fields and crops
Figure 11.2 – Impact of Impervious Area on the Hydrologic Cycle Fluxes
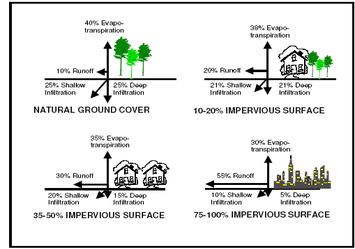
40% Evapotranspiration, 10% Runoff, 25% Shallow Infiltration, 25% Deep Infiltration for Natural Ground Cover; 35% Evapotranspiration, 30% Runoff, 20% Shallow Infiltration, 15% Deep Infiltration for 35-50% Impervious Surface; 38% Evapotranspiration, 20% Runoff, 21% Shallow Infiltration, 21% Deep Infiltration for 10-20% Impervious Surface; 30% Evapotranspiration, 55% Runoff, 10% Shallow Infiltration, 5% Deep Infiltration for 75-100% Impervious Surface.
Adapted from: Prince Georges County Department of Environmental Resources Programs and Planning Division, 1999. Low-impact Development Design Strategies: An Integrated Design Approach. Department of Environmental Resources, Prince Georges County, Maryland.
Good stormwater management does not begin with site disturbance and construction. Decisions about lot layout, building density, location of public rights-of-way, protection of sensitive areas, and preservation of open space all have an impact on the quality and quantity of stormwater runoff.
When using site-planning techniques to control stormwater, designers should keep local zoning, land division and building codes in mind. Many communities have adopted site design or land division criteria to serve a variety of land use goals that may or may not directly relate to stormwater runoff.
Examples include:
- Preserving neighborhood or rural character
- Protecting specific natural or scenic resources
- Promoting smooth traffic flow
- Allowing for future land division
- Ensuring adequate pedestrian, bicycle or emergency vehicle access
Usually, such goals complement or reinforce good design for stormwater control. However, in some cases, such as choosing between grid-pattern or cul-de-sac street layouts, the designer may need to strike a balance between competing land use goals. For example, in a community seeking to promote traditional neighborhood design, engineered stormwater basins may be preferable to a curvilinear street layout.
Many techniques can be employed during the site planning and design stage of development to reduce the volume of runoff, thus reducing the need for structural practices to store and treat stormwater. Design and location of stable outlets for site runoff is also important to consider at this time, to avoid causing problems for downstream neighbors. Consider implementing the following techniques (which are listed in order of priority) and manage runoff as close to the source as possible to minimize the volume of stormwater runoff.
A. Identify and Avoid Sensitive Areas
Local variations in topography, soil types, vegetation and hydrology can have a significant influence on the nature and amount of stormwater runoff. The first step in site planning for stormwater management should be identification and mapping of areas that:
- Contain features that could be adversely impacted by stormwater runoff (such as wetlands, floodplains, lakes, streams, and shallow fractured bedrock);
- In their natural state, contribute to infiltration, soil and water retention, groundwater recharge or temperature control (such as highly pervious soils, native grasslands, woodlands or hydric soils);
- Provide natural drainage ways for surface water runoff (such as intermittent or perennial streams, natural or artificial drainage ways); or
- Could be a source of sedimentation, channelized flow or erosion if disturbed (such as steep slopes or easily eroded soils).
- Contain cultural resources, which are protected by federal law. Cultural resources can be found at: http://www.ia.nrcs.usda.gov/technical/culturalresources.html
Development should be designed and construction operations planned to avoid disturbing these areas wherever possible. Federal, state or local regulations protect some natural features, such as wetlands or navigable waterways. Changes in volume and direction of stormwater flow resulting from development or other stormwater practices should be carefully designed and controlled to avoid secondary impacts to natural areas. For example, increased runoff volume can erode streambeds and banks or damage natural wetlands without careful consideration early in the planning process.
Working around sensitive areas should be incorporated as part of the preliminary design, which not only avoids these areas but also highlights them as natural amenities that add value to the development. These sensitive areas complement the functions and values provided by the countywide network of open space corridors.
B. Minimize Impervious Surfaces
Impervious surfaces are the primary source of runoff in both small and large storm events. Hence, the single most effective means of reducing runoff volume is by minimizing the site's impervious surface area.
The single most effective means of reducing runoff volume is by minimizing the site’s impervious surface area.
1. Preserve and Reproduce Pre-Development Hydrologic Conditions
- Utilize natural drainage flow paths. Dubuque County strongly recommends the use of grass waterways, vegetated drainage channels and/or water quality swales along street right-of-ways or back lots to channel runoff without abrupt changes in the direction of flow.
- Restore soil permeability. Use practices such as deep tilling, chisel plowing and incorporating organic matter into the upper soil layer to restore soil infiltration capacity on heavily disturbed sites. When soil is compacted, its capacity to infiltrate water is greatly diminished. On heavily disturbed sites where practices are used to restore soil permeability, the county may waive the requirement to lower the soil permeability class rating in hydrologic calculations.
- Minimize directly connected impervious area. Any impervious surface that drains into a catch basin, area drain, or other conveyance structure is a "directly connected impervious area (DCIA)." Impervious surfaces also increase the runoff rate (reducing the runoff time of concentration) and runoff volume, which may cause higher peak flows downstream, and increase flood and erosion potential. To minimize directly connected impervious areas, downspouts and driveways should be directed to pervious areas, where feasible. This promotes infiltration and reduces the velocity of runoff water. Other strategies for minimizing connected impervious area include directing sheet flow through vegetated areas and locating impervious areas so they drain to vegetated buffers or other pervious areas.
- Use bioretention and other practices to increase infiltration. Bioretention basins are engineered practices that use natural processes, including microbial soil processes, infiltration, and evapotranspiration to improve stormwater quality. Rain gardens, often very attractive, are one type of practice commonly designed for residential lots to soak up rainwater from roofs, driveways, and lawns.
- Include green infrastructures. Developed areas may provide self-treatment of runoff via the use of green infrastructures if properly designed and drained. Green infrastructures may consist of conserved natural spaces, large landscaped areas (including parks and lawns), grass/vegetated swales, and turf block paving areas. The infiltration and bio-treatment inherent to such areas may provide the treatment control necessary. These areas therefore act as their own BMP, and no additional BMPs to treat runoff should be required.
2. Site and Lot Vegetation
- Predevelopment vegetation. Maintain as much predevelopment vegetation as possible. Vegetation prevents erosion and absorbs water and, therefore, reduces runoff volume.
- Swales. Use shallow grassed roadside swales, boulevards and sunken parking lot islands with check dams instead of curb and gutter storm drain systems to handle runoff, wherever possible.
- Natural buffers and drainage ways. Maintain natural buffers between development sites and water bodies. Buffers slow runoff, remove sediment and enhance infiltration. Natural depressions and channels should be maintained to slow, store, and infiltrate water.
3. Streets and Roads
- Road length. Minimize subdivision roadway length by using a roadway layout with the least pavement length suitable for the site’s topography and other planning goals.
- Road width. Work within local zoning requirements and planned unit development provisions to minimize road width by narrowing road sections and/or reducing on-street parking. On-street parking may be restricted to one side of the street or eliminated altogether. Pavement and right-of-way width must still meet minimum standards described in local land division and zoning ordinances, and should allow for safe vehicular travel and emergency vehicle access.
- Design road patterns to match landforms. In rolling terrain, for example, local streets should branch from collector streets and end in short loops or cul-de-sacs, where consistent with other local ordinances and land use goals. Some local ordinances and plans seek to create traditional grid patterns or limit the use of cul-de-sacs to address traffic, neighborhood character or other design objectives.
4. Lot Layout
- Rooftops. Reduce the impervious rooftop area by minimizing the building footprint of houses or utilizing green roof technology. Use vertical space rather than horizontal house layouts. Sod or vegetative "green roofs" rather than conventional roofing materials.
- Driveways. Where permitted under local driveway, zoning or land division ordinances, reduce impervious driveway area by using shared driveways, limiting driveway width, using pervious pavement, and using reduced building setbacks.
- Parking lots. For commercial sites, reduce overall impervious area by providing compact car spaces, eliminating excessive or unnecessary spaces, utilizing shared parking, minimizing stall dimensions, incorporating efficient parking lands, and using pervious materials in spillover parking areas.
C. Low-Impact Development (LID) and Conservation Subdivision Design
Many of the practices and techniques discussed above are commonly referred to as "low-impact design" or "conservation subdivision design". Both low impact designs and conservation subdivisions have common goals; however, they have different strategies in obtaining that goal.
Low Impact Development is a site design strategy with a goal of maintaining predevelopment hydrologic conditions by managing runoff at the source using uniformly distributed stormwater management facilities. Instead of conveying and treating stormwater in large facilities located at the bottom of drainage areas, LID addresses stormwater through small, cost-effective landscape features located at the lot level. The low-impact analysis and design approach focuses on the following hydrologic analysis and design components:
- Runoff curve number (RCN): Minimizing change in post-development hydrology by reducing impervious areas and preserving more trees and meadows to reduce the storage requirements to maintain the pre-development runoff volume.
- Time of concentration (Tc): Maintaining the predevelopment Tc in order to minimize the increase of the peak runoff rate after development by lengthening flow paths and reducing the length of the runoff conveyance systems.
- Infiltration: Manage water quality volume through infiltration.
- Retention: Providing permanent pool storage for volume and peak control, as well as water quality control, to maintain the same storage volume as the pre-development condition.
- Detention: Providing additional storage above permanent pool levels, if required, to maintain the same peak runoff rate and/or prevent flooding for storm recurrence intervals ≥ 5-10 years.
Conservation subdivision designs are characterized by common open space and clustered compact lots. The purpose of a conservation subdivision is to protect sensitive and valuable open space, habitat and other environmental resources while allowing for the maximum number of residences under current community zoning and subdivision regulations. Figures 11.3, 11.4, and 11.5 compare a conventional subdivision layout with a subdivision incorporating conservation design practices.
Watershed Management
Figure 11.3 - Conservation Design Subdivision Layout
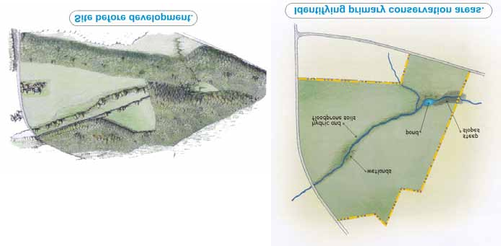
Figure 11.4 - Conservation Design Subdivision Layout Continued
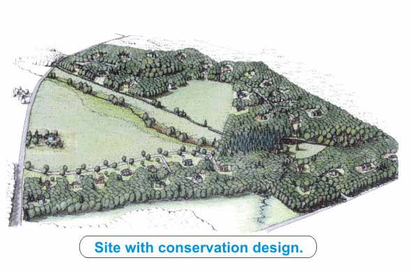
Source: http://www.mass.gov/envir/smart_growth_toolkit/pages/mod-lid.html
Figure 11.5 - Comparing Conventional and Conservation Subdivisions.
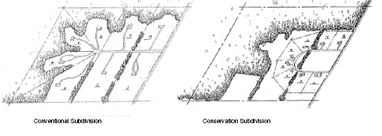
Source: Ordinance for a Conservation Subdivision, UWEX, Brian Ohm.
During plan review, LID and conservation subdivision design and other practices may need to be evaluated to ensure that the land division meets or exceeds subdivision ordinance requirements or planned-unit development (PUD) approval procedures.
Cost Considerations – Incorporating LID.
Often times, critics of conservation design and LID practices raise concern over the high costs of incorporating LID into subdivisions. What may seem like a simple question, can often be very difficult to analyze and has several dimensions, making it more of a complex topic. It is important to analyze the word “costs” by several dimensions: planning, design, capital costs, short-term vs. long-term maintenance, land values, transportation surfaces, and environmental impacts.
Figure 11.6 is offered to help planners, engineers, regulators, and developers compare the costs and benefits of LID with a more conventional land development approach.
160
Watershed Management
Figure 11.6 - Qualitative Cost Comparison – How LID Practices Compare with Conventional Practices
| LID Practice | Design Costs | Construction Costs | Long-Term Maintenance Costs | Increased Land Values | Decreased Environmental Impact |
|---|---|---|---|---|---|
| Better Site Design | 😊 | 😊 | 😐 | 😊 | 😊 |
| Better Local Roads | 😊 | 😊 | 😊 | 😊 | 😊 |
| Bioretention/Rain Gardens | 😊 | 😐 | 😊 | 😊 | 😊 |
| Infiltration/Permeable Pavements | 😐 | 😐 (1) | 😐 (1) | 😊 | 😊 |
| Stormwater Planters | 😊 | 😐 | 😐 | 😊 | 😊 |
| Vegetated Swales | 😊 | 😊 | 😊 | 😊 | 😊 |
| Vegetated Buffers | 😊 | 😊 | 😊 | 😊 | 😊 |
| Cisterns/Rain Barrels | 😊 | 😊 | 😐 (1) | 😊 | 😊 |
| Green Roofs | 😐 | 😐 (1) | 😊 | 😐 | 😊 |
- 😊 - LID practice compares favorably with conventional approach (e.g., costs less)
- 😐 - LID practice compares unfavorably with conventional approach (e.g., costs more)
- (1) - Costs may be too close to call, or even favorable when all costs such as heating, cooling, roof replacement, irrigation, or additional downstream detention are considered.
Source: Massachusetts State, Smart Growth/Smart Energy Toolkit
D. Watershed-Wide Planning for Stormwater Management
The Dubuque County Manual, while focusing on plans and practices to meet the erosion control and stormwater needs of particular sites, encourages watershed-wide planning. Ideally, stormwater management should be conducted as part of a watershed plan.
In watershed-wide planning, communities can work together across municipal boundaries to identify potential locations for regional stormwater treatment facilities, and coordinate on-site basins and outlets to reduce the effect of combined peak discharges after storm events. They can also collectively identify areas where stormwater treatment facilities should not be located, e.g. in hydric or alluvial soils, and target areas where they are preferred, e.g. deep sandy soil. Such a collaborative approach may result in significant cost savings from economies of scale and shared responsibility.
E. Regional Stormwater Management
Using individual, onsite structural stormwater management facilities for each development is the typical approach for downstream flood control. The developer finances the design and construction of these management facilities, and is initially responsible for all operation and maintenance. A potential alternative approach is for a community to install strategically-located regional stormwater management facilities in a sub-watershed rather than require onsite management facilities. Regional stormwater management facilities are designed to manage stormwater runoff from multiple projects and/or properties through a local jurisdiction-sponsored program, where the individual properties may assist in the financing of the facility, and the requirement for onsite management facilities is either eliminated or reduced. Figure 11.7 lists some advantages and disadvantages of regional facilities as compared to individual on-site facilities.
Figure 11.7 – Advantages and Disadvantages of Regional Stormwater Management Facilities
| Advantages |
|---|
| Reduced construction costs |
| Reduced operation and maintenance costs |
| Ability to serve as a recreational and aesthetic amenity for a community |
| Ability to maximize the intent of the proposed project. (The area set aside for stormwater management facilities is minimized) |
| Higher assurance of maintenance |
| Mitigates existing developments with insufficient stormwater management facilities while also providing for future development |
| Disadvantages |
|---|
| Determining an effective location can be difficult |
| Initial capital costs can be high |
| Substantial planning, financing and permitting are required. |
| The local government may need to establish a stormwater utility or alternative program to fund and implement stormwater control. |
If a community decides to implement a regional stormwater control, it must ensure that the conveyances between the individual upstream developments and the regional facility can handle the design peak flows and volumes without causing adverse impact or property damage. Full build-out conditions in the regional facility drainage area should be used in the analysis. In addition, unless the system consists of completely man-made conveyances (i.e. storm drains, pipes, concrete channels, etc.); onsite structural management facilities for water quality and downstream channel protection will be required for all developments within the facility's drainage area.
Federal water quality provisions do not allow the degradation of water bodies from untreated stormwater discharges, and it is U.S. EPA policy to not allow regional stormwater management facilities that would degrade stream quality between the upstream development and the regional facility. Without onsite water quality and channel protection, regional management facilities do not protect smaller streams upstream from the facility from degradation and stream bank erosion. Upstream inundation from a regional facility impoundment can eliminate floodplains, wetlands, and other habitat. Further, without adequate channel protection, aquatic habitats and water quality in the channel network upstream of a regional facility may be degraded by stream bank erosion if they are not protected from bank-full flows and high velocities. Based on these concerns, both the EPA and the U.S. Army Corps of Engineers have expressed opposition to in-stream regional stormwater control facilities. In-stream facilities should be avoided if possible, and will likely be permitted on a case-by-case basis only.
F. Dubuque County Erosion Control and Stormwater Ordinance
In March of 2010, the Dubuque County Board of Supervisors passed a countywide Erosion Control and Stormwater Management Ordinance. In addition to the Ordinance, Dubuque County worked with a local engineering firm to complete a Stormwater Management Manual.
This manual can be found online at http://www.dubuquecounty.org/Zoning/Forms/tabid/156/Default.aspx or by visiting the Dubuque County engineering or zoning office. The manual does an excellent job of detailing applicability, performance standards, and management practices that can be used in both pre-construction and post-construction practices.
The following goals and objectives are intended to guide the communities of Dubuque County in providing relevant information to all residents of Dubuque County regarding watersheds. The following goals encompass and highlight how existing and future development impact our county watersheds, and what objectives can be taken to mitigate and prevent watershed degradation.
- To prevent and limit erosion by establishing preconstruction sediment control measures before, during, and after any land disturbing activities take place to improve the health of our local watersheds.
- Plan for and design effective erosion and sediment control structures before any land disturbing development occurs.
- Install and maintain erosion and sediment control structures and monitor for continued effectiveness throughout until development is complete and full build out occurs.
- Identify and avoid developing in environmentally sensitive areas including stream banks, flood plains and low lying areas; steep slopes, bluff lands and slide prone areas; areas containing shallow soils or fractured limestone; karst areas and areas with low water tables that can have a significant influence on erosion.
- To prevent erosion and control sediment during construction.
- Address areas that are prone to and/or have erosion problems with stabilization control Best Management Practices (BMPs) including, but not limited to grass channels, dust control, mulching, seeding and fertilizing, silt fence, sod, surface roughening, vegetative filter strip, compost blankets, compost filter tubes, rolled erosion control products (RECPs), wattles, flocculants, and turf reinforcement mats (TRMs) when working in existing built environments.
- Build and maintain structural erosion and sediment control Best Management Practices (BMPs) including, but not limited to benches, compost filter berms, check dams, temporary slope drains, energy dissipaters, flotation silt curtains, rock chutes and flumes, gabions, inlet protection, jetties, level spreaders, rock outlet protection, retaining walls, stabilized construction entrances, rip-rap, sediment barriers, sediment basins, streambank protection, stream channel enhancement, subsurface drainage, and diversion structures as any land disturbing activities take place.
- To reduce the rate and volume of stormwater runoff on post construction development, while at the same time promoting better water quality using infiltration based practices and controls.
- Utilize Low-Impact Development (LID) principles and Conservation Subdivision Design to promote good stormwater management through smaller building lots, higher density standards, reduction of public right-of-way and protection of sensitive areas through preservation of open space.
- Use stormwater management BMP’s during the site planning and design stage of development to reduce the volume of runoff, thus reducing the need for large retention and detention structures to store and treat stormwater.
- Design and strategically locate drainage outlets for site runoff that limits negative impacts to downstream neighbors.
- Minimize impervious surfaces in development which are the primary source of runoff for both small and large storm events to reduce runoff volume.
- To preserve and reproduce pre-development hydrologic conditions whenever possible to maximize runoff infiltration and reduce flooding and to promote healthy water supplies.
- Utilize natural drainage flow paths using grass waterways, vegetated drainage channels and/or water quality swales along street right-of-ways or the back of lots to channel
runoff without abrupt changes in the direction of flow.
- Restore soil permeability using practices such as deep tilling, chisel plowing and incorporating organic matter into the upper soil layer to restore soil infiltration capacity on heavily disturbed sites to maximize water infiltration.
- Minimize directly connected impervious areas or any impervious surface that drains into a catch basin, area drain, or other conveyance structure by outletting downspouts onto grassy areas and directing runoff from driveways to pervious areas to promote infiltration and reduce the velocity of runoff water.
- Use bioretention and other similar practices such as rain gardens to soak up rainwater from roofs, driveways, and lawns which will increase natural infiltration, microbial soil processes and evapotranspiration and will improve stormwater quality and quantity.
- Include green infrastructure measures such as conservation of natural habitat and green space consisting of large landscaped areas (including parks and lawns), grass/vegetated swales, and turf block paving areas to treat and infiltrate runoff.
5. To protect and establish site and lot vegetation to prevent erosion and infiltrate runoff.
- Maintain as much predevelopment vegetation as possible to prevent erosion and absorb water reducing runoff volume.
- Use shallow grassed roadside swales, boulevards and sunken parking lot islands with check dams instead of curb and gutter storm drain systems to handle runoff, wherever possible.
- Maintain natural buffers, depressions and channels between development sites and water bodies to slow runoff, remove sediment and enhance infiltration.
6. To design transportation surfaces that account for and minimize stormwater runoff.
- Minimize subdivision roadway length by using a roadway layout with the least pavement length suitable for the site's topography and other planning goals.
- Minimize road width by narrowing road sections and/or reducing on-street parking to one side of the street or eliminating it altogether.
7. To design buildings and lots that account for and minimize stormwater runoff.
- In high density, urban areas, reduce the impervious rooftop area by minimizing the building footprint of buildings by using vertical space rather than horizontal layouts or utilizing green roof technology by using sod or vegetative 'green roofs' rather than conventional roofing materials.
- Reduce impervious surfaces by using shared driveways, limiting driveway width, using pervious pavement, and reducing building setbacks.
- Reduce overall impervious area on commercial sites by providing compact car spaces, eliminating excessive or unnecessary spaces, utilizing shared parking, minimizing stall dimensions, incorporating efficient parking layouts, establish maximum parking area requirements, and using pervious materials in spillover parking areas.
8. To establish standards and/or guidelines for the quantity and quality of water runoff that are flexible and that recognize the unique characteristics of each project site, to obtain maximum protection of the watersheds in the region.
- Encourage local governments to adopt and/or create erosion control and stormwater ordinances or policies.
- Encourage agricultural producers and landowners to participate in state and federal
Watershed Management
government conservation and water quality programs that provide both erosion and sediment control and manage stormwater runoff.
8.3. Encourage landowners to utilize federal, state, and local resources to help with design, assessment, and cost-share opportunities for landowners to install conservation practices.
- To reduce flood damages by promoting basin wide programs stressing non-structural measures, such as floodplain regulations, floodproofing, flood forecasting, and watershed treatment, in conjunction with other structural measures, where necessary, to protect the lives and property of residents.
- Locate future development outside of flood hazard areas where feasible, and where development is allowed in the floodplain, require it to be elevated, floodproofed and located outside the floodway.
- Ensure that local flood management programs meet or exceed regulatory requirements of the Federal Emergency Management Agency, and applicable state regulations.
- Design local flood management programs to allow public and private options, while protecting life and property from storm water runoff generated by one-hundred year storm events.
- Stress retention of natural drainage patterns and construction of detention systems to help ensure development activity will not add substantially to the flood problem.
Map 11.2 City of Asbury Watersheds/Drainage Basins
166
Watershed Management
Map 11.5 - City of Dyersville Watersheds/Drainage Basins
Map 11.6 - City of Epworth Watersheds/Drainage Basins
168
Watershed Management
Map 11.7 - City of Farley Watersheds/Drainage Basins
Map 11.8 - City of Peosta Watersheds/Drainage Basins
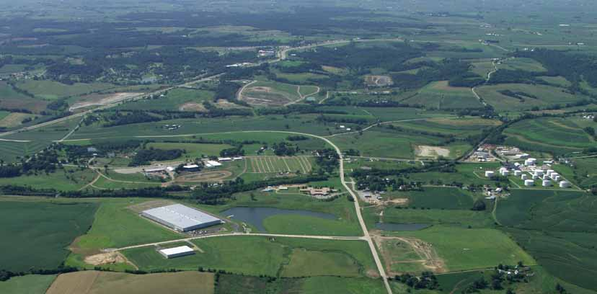
Chapter 12
Land Use Trends
Land use planning is one of the most important and complex tasks for local governments. Transportation, economic development, housing, community facilities, and utilities are all related to land use. In planning for land use, communities must implement policies that may not produce benefits for many years. Communities must also resist projects and policies that may provide benefits today, but may cause problems in the future. The goal of this chapter is to help communities plan for a sustainable future by producing land use policies and ordinances that promote economic development, good quality of life, and allow government to provide services in the most efficient manner possible over the long term.
Land Use Trends
Changes in land use patterns are the result of a complex mix of market forces, regulations, public and private investments, and global economic conditions. While it is difficult to quantify the impact of any one factor on land use, a general understanding of the underlying causes of these trends can help communities understand their past and plan for their future.
Population Growth – After declining during the farm crisis of the 1980s, Dubuque County’s population rebounded in the 1990s. Figure 12.1 shows the historical population trend for the City of Dubuque and Dubuque County. In the two decades since the 1990 census, the County added 7,250 new residents to reach a 2010 census population of 93,653.
Figure 12.1 - City of Dubuque and Dubuque County Historical Population
Land Use
is the most populous city in the County with a 2010 census population of 57,637, but the City of Dubuque's population growth has not kept pace with the rest of the County since 1990. Of the new population growth that has occurred since 1990, 98% has been located in the county's smaller cities and unincorporated areas. New population growth in the unincorporated areas and smaller towns is part of a larger residential trend that began over 50 years ago. In the 1960 census, 71% of Dubuque County residents lived in the City of Dubuque, but by the 2010 Census only 62% of County residents lived in Dubuque.
Employment - While the population has become more dispersed throughout the County, employment has remained more centralized. The Map 12.1 shows the residential population is spread across the county, while Map 12.2 shows that employment is more concentrated in the City of Dubuque. In 2010, more than 75% of jobs within Dubuque County were located in the City of Dubuque.1
Annexations - In addition to countywide shifts in population and employment, change has also occurred within cities. Over the past 20 years, Dubuque County cities have grown in size. Map 12.3 illustrates the expansion of Dubuque County's urban areas during this time. Since 2000, cities have annexed a total of 5,213 acres of land in Dubuque County. Consortium cities have also annexed land in neighboring Counties. Dyersville has annexed 684 acres in Delaware County, and Cascade has annexed 31 acres in Jones County.2
The overall development trend in recent Dubuque County history has been outward growth and expansion of developed areas. In general, the development in Dubuque County has become more spread out. The County's development trend is in line with national post World War II development trends that is referred to as sprawl or suburbanization. Following the war, people began to leave central cities in favor of low density suburban neighborhoods and rural communities.
Existing Land Use - The Smart Planning Consortium created maps that illustrate the existing land uses in Dubuque County. Maps 12.5-12.12 are located at the end of this chapter.
1 U.S. Census Bureau. 2012. On The Map Application. Longitudinal-Employer Household Dynamics Program. http://onthemap.ces.census.gov/
2 Dubuque County; Delaware County; Jones County; 2012.
Map 12.1 - Population Per Square Mile
Data: US Census Bureau Center for Economic Studies, 2012
Map 12.2 - Jobs Per Square Mile
Data: US Census Bureau Center for Economic Studies, 2012
Map 12.3 - Dubuque County Annexations
Dubuque County Annexations Since 2000
Data: Dubuque County and Iowa DOT.
Causes of Land Use Trends
Identifying trends is a good first step for land use planning. The next step is understanding the driving factors behind the trends. The trend of low density development in Dubuque County was part of a national trend driven by post-war prosperity and the rise of the automobile as the dominant mode of transportation. These changes in the economy and technology were combined with changes to development patterns, transportation, and zoning codes to alter how cities in the United States were built.
Development Patterns – The methods by which municipalities grow have changed. Prior to World War II, areas mapped for development included each of the essential town-making elements – streets, parks, housing, commercial and civic buildings. Growth was mixed-use, compact, and building design varied. Prior to World War II, new buildings were often occupied by their builder. This resulted in an increase in the variety of building forms, often representing regional European origins, within neighborhoods. Since World War II the prevalence of entire neighborhoods developed by single builders has become the norm. To control costs and decrease construction timelines, developers have chosen to use repetitive residential building blueprints within a community. In addition, the expansion of commercial chains has resulted in the repetition of commercial building blueprints from one community to the next.
Transportation Investments – Traffic engineering and public works manuals routinely prescribe wide thoroughfares designed for a single transportation mode, the automobile. Solutions to traffic congestion often revolve around building additional vehicle lanes, promoting faster speeds, and pushing land development further from urban cores until congestion increased and the process was repeated. Transportation manuals also prescribe a hierarchical road network that forces drivers along a limited number of arterial roads, limiting connectivity, dispersion, and flexibility of route choice. Connective grids, on the other hand, are designed to calm traffic, slowing vehicle speeds and making streets narrower and hence more walkable. They also provide a choice of alternate driving routes when one is blocked. In addition, the proliferation of Complete Street policies by municipalities has led transportation planners and engineers to routinely design and operate the entire right of way to enable safe access for all users, regardless of age, ability, or mode of transportation.
Zoning Codes – The first zoning ordinance in the United States was adopted in 1916 by the City of New York, NY to combat public health issues from poor living and working conditions, industrial pollution, and to protect access to sunlight. In the 1920s the Hoover Administration advocated for states to adopt the Standard State Zoning Enabling Act (SZEA), which authorized the adoption of zoning ordinances to regulate and restrict the erection, construction, reconstruction, alteration, repair, or the use of buildings, structures, or land to promote the health, safety, morals, and general welfare of the community. A city's authority to enact zoning regulations was first upheld by the US Supreme Court in 1926 under Euclid vs. Ambler, thus giving rise to the term "Euclidean Zoning", the traditional form of zoning adopted and still in use by most communities in the United States. Euclidean Zoning is also referred to as Traditional Zoning or Use-Based Zoning. The main feature of Traditional Use-Based Zoning is the segregation of land uses into three main categories: residential, commercial, and industrial.
Traditional zoning ordinances have brought order to our development patterns, but have drawn criticism for creating sprawl by segregating land uses and promoting large lot sizes. This separation has made our development patterns inefficient, forcing residents to drive longer distances to get to their jobs, schools, shops, and services which increases congestion, air pollution, and greenhouse gas emissions.
Recommendations
The final step of good land use planning is to identify issues created by the current trend and implement changes to alter the trend and correct the issues.
Traditional Development Pattern – Many of the Consortium's recommendations for correcting the region's land use problems are not new ideas. In fact, mixed-use development, grid street patterns, complete streets, and higher density are based on the design of pre-World War II development. Many communities can look at the traditional development pattern used in older parts of their cities to improve the sustainability of their town.
The traditional development patterns of the pre-WWII era are used as an example for good land use planning because they have stood the test of time. During the early part of the 20th Century most buildings were constructed by immigrants who used traditional European styles. These development patterns had been created over thousands of years of experimentation, and have been used and sustained themselves over time. Builders at this time needed to be masters of efficiency. They needed to extract the most value possible out of the land available, and they did so without many of the advantages we have today. Dubuque County communities can use design ideas from their downtowns and traditional neighborhoods to improve the sustainability of their community.
Mixed Uses – Standard zoning codes are based on separating property uses. The community is divided into areas for residential, commercial, and industrial. Euclidian zoning codes were first created in the 1920's to prevent negative impacts by separating incompatible land uses. Zoning codes were intended to separate factories that emitted heavy pollution and noise from residential areas. While these industrial uses still exist today, many commercial land uses can coexist with residential uses without negative impact. Mixed use areas also provide many benefits. Residents of mixed use neighborhoods have more opportunities to walk because their job, shopping, entertainment, and schools are located nearby. Increased walking will result in reduced traffic congestion and vehicle emissions, and improved public health.
Environmental – Traditional zoning codes were not intended to create sprawl or obstruct traditional villages, towns, or urban neighborhoods. Their primary concern was to protect the public health and safety by separating dangerous or noxious industrial operations from residential areas, and controlling density for health purposes. But in hindsight, at least since the nature of industry has changed in the 20th Century (due in part to both federal regulations and self-policing resulting from the Environmental Movement), traditional use-based zoning has actually had a negative impact on the public health overall. In our present development pattern, we must drive from place to place, enduring the stresses of congested traffic and wasted time, while polluting our air and depleting natural resources. Meanwhile, we walk much less than we would if our daily needs and destinations were close by. The health benefits of walking have been thoroughly documented.
Land Use
Form Based Codes
Form Based Codes are a type of land development regulatory tool (i.e. zoning code) that places greater emphasis on the physical form of the built environment with the end goal of producing a specific type of place. Form-based codes can help a community support mixed uses, diverse housing options, and open space while also paying attention to design details such as streetscapes and façades. Because they are simpler to envision than conventional codes, form-based codes provide a community with a certain level of predictability about the public realm, whether applied to new or existing development. Form-based codes can be a helpful tool for communities looking to revitalize downtowns and preserving small-town character.
Figure 12.2 - Dubuque County Model Transect
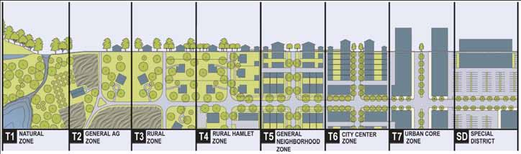
Source: Dubuque County Rural Model Smart Code
Form-based codes use the transect concept to arrange zoning districts based on a geographical cross section of a region. Such a cross-section can be used to identify a set of zones that vary by their level and intensity of development and character, a continuum that ranges from natural-to-rural-to-urban. In the Summer of 2012, the Consortium participated in a planning process to develop a Rural Model Smart Code for the region. Figure 12.2 is a model transect that was developed for the Rural Model Smart Code.
Code Coordination - Communities in Dubuque County must work together for any updated zoning and subdivision codes to have the greatest effect. Under Iowa Code, communities are given extraterritorial subdivision review. This gives communities the ability to review subdivision applications within two miles of their city boundary. This extraterritorial review can help cities by allowing them to require new rural subdivisions within two miles to meet their development standards. Extraterritorial review also can have a negative impact. New subdivisions may choose to locate outside of the two-mile review zone to avoid building to city standards. This leapfrog development can drive additional sprawl in the rural areas of the county. Combating leapfrog development will require coordination of development policies with the County.
Complete Streets - Spread out auto-dependent development patterns can place a heavy burden on non-drivers. Medical issues, age restrictions (under 16), and financial limitations can prevent people from driving, but low density single use development requires a car to get to daily needs such as work, school, or shopping. In addition to long distances, safety can also be an issue for pedestrians and cyclists. Roadways are designed to move a large number of vehicles as fast as possible. The roads have become somewhat safer, but pedestrian fatalities have fallen at only half the rate of motorist fatalities, dropping by just over 14 percent between 2000 and 2009, compared to 27 percent for motor vehicle fatalities.3
Neighborhoods that have a grid-like street network equipped with sidewalks and bike lanes encourage residents to walk or bicycle to their destinations by reducing travel distances and improving safety. Compact and mixed-use developments are also important components of walkability, ensuring that essential destinations are centrally located and accessible. Walking and bicycling benefit public health, reduce pollution, and create more livable neighborhoods. From economic, environmental, community, and public health perspectives, the development pattern of communities should allow for safe and convenient walking and bicycling opportunities. Distances between rural communities certainly make walking and bicycling more challenging. A good trail system that links neighborhoods with rural routes and downtown destinations in nearby communities can serve as a recreational or tourism resource as well as a commuter route that is protected from higher-speed roads. Trail systems, such as the Heritage Trail, also provide economic and social benefits to adjoining areas.
Maximize Return on Investment - One of the biggest problems with low-density development is the strain it can place on a city’s budget. This strain may not be noticeable during good economic times, but it can come back to hurt communities during a downturn. The current economic climate has forced several communities across the United States into bankruptcy. Since 2010, seven municipalities including Harrisburg, PA, San Bernardino, CA, and Stockton, CA have filed for bankruptcy. There are numerous reasons behind these cities’ financial problems including rising pension costs, but low-density development can also play a role in a city’s financial problems. Cities spend more providing services such as water, sewer, and roads to a spread out subdivision built far away from existing infrastructure than they do when providing the same services to a less spread out neighborhood. New development can be an initial sign of prosperity, but inefficiencies multiplied over several new subdivisions over a few decades can hurt a community in the long run.
Communities can help improve their fiscal situation by investing in development patterns that maximize return on investment. Communities invest in the installation and maintenance of infrastructure to stimulate private sector investment and development, which creates value in the local economy. The value created is taxed and the tax revenue is used in part to pay for the maintenance of the infrastructure. A community that wants to get more value out of its investment should consider investing in the most productive types of development. Tax revenue per acre is the most accurate measure of a building’s productivity because it provides a direct comparison between different properties and accounts for differences in a property’s size. See the Public Infrastructure and Utilities chapter for an extended discussion of tax revenue, infrastructure, and return on investment. Figure 12.3 shows a comparison of 14 properties in the City of Dubuque. Several properties including the Kennedy Mall and Wal-Mart pay large amounts of property tax, but take up large amounts of space. Other buildings in the downtown area pay small total amounts of tax but are compact multistory buildings that pay more tax per acre than the larger buildings.
3 http://t4america.org/resources/dangerousbydesign2011/
174
A community that wants to get more value out of its investment should consider investing in the most productive types of development. Tax revenue per acre is the most accurate measure of a building’s productivity because it provides a direct comparison between different properties and accounts for differences in a property’s size. See the Public Infrastructure and Utilities chapter for an extended discussion of tax revenue, infrastructure, and return on investment. Figure 12.3 shows a comparison of 14 properties in the City of Dubuque. Several properties including the Kennedy Mall and Wal-Mart pay large amounts of property tax, but take up large amounts of space. Other buildings in the downtown area pay small total amounts of tax but are compact multi-story buildings that pay more tax per acre than the larger buildings.
Figures 12.3 and 12.4 show that high density urban development provides a high return on infrastructure investment. Investing in land uses that use infrastructure most efficiently by adopting smart planning principles can help communities keep property taxes and utility rates low. Many communities would spend great amounts of time and effort to attract one large factory to their town, but updating existing infrastructure and attracting several new businesses to their downtown may be a more practical and financially productive solution for economic development.
Low Impact Development – Due to recent flooding in the area, water quality and stormwater management are important issues for Dubuque County. Change in land use, especially urbanization, dramatically affects the hydrologic cycle by altering the relative percentage of precipitation that contributes to groundwater, evapotranspiration, and runoff relative to the natural ground cover. Specifically, urbanization increases runoff by decreasing the amount of water that infiltrates into the ground and is taken up and transpired by plants. This is because water cannot infiltrate into, and plants cannot grow on, impervious surfaces such as pavement and rooftops. Decisions about lot layout, building density, location of public rights-of-way, protection of sensitive areas, and preservation of open space all have an impact on the quality and quantity of stormwater runoff.
Communities can help improve water quality and
| Property | Total Tax | Total Acres | Tax Revenue Per Acre |
|---|---|---|---|
| Downtown Single Family | $ 838 | 0.09 | $ 9,311 |
| Urban Single Family | $ 2,106 | 0.45 | $ 4,680 |
| Rural Single Family | $ 3,852 | 1.3 | $ 2,963 |
| 378 Main | $ 8,044 | 0.05 | $ 160,880 |
| 342 Main | $ 13,476 | 0.08 | $ 168,450 |
| 756 Main | $ 14,440 | 0.06 | $ 240,667 |
| Burger King | $ 24,006 | 0.92 | $ 26,093 |
| Walgreens | $ 38,408 | 1.15 | $ 33,398 |
| American Trust Building | $ 78,362 | 0.14 | $ 559,729 |
| Target | $ 159,536 | 8.17 | $ 19,527 |
| Hotel Julien | $ 297,722 | 1.83 | $ 162,690 |
| Roshek Building | $ 318,530 | 0.67 | $ 475,418 |
| Walmart | $ 385,682 | 33.7 | $ 11,445 |
| Kennedy Mall | $ 1,094,672 | 46.55 | $ 23,516 |
Figure 12.3 - Tax Revenue Per Acre
Source: Dubuque County and City of Dubuque Assessor
Figure 12.4 - Tax Revenue Per Acre
Source: Dubuque County Assessor and City of Dubuque Assessor
Communities can prevent flooding by incorporating Low-Impact Development (LID) and Conservation Subdivision Design into their local ordinances. Low Impact Development is a site design strategy with a goal of maintaining predevelopment hydrologic conditions by managing runoff at the source using uniformly distributed stormwater management facilities. Instead of conveying and treating stormwater in large facilities located at the bottom of drainage areas, LID addresses stormwater through small, cost-effective landscape features located at the lot level. Conservation subdivision designs are characterized by common open space and clustered compact lots. The purpose of a conservation subdivision is to protect sensitive and valuable open space, habitat and other environmental resources while allowing for the maximum number of residences under current community zoning and subdivision regulations.
Invest In Existing Downtowns and Traditional Neighborhoods - Infrastructure can be a barrier to redevelopment of an older neighborhood. In some cases, communities have diverted maintenance funding away from existing neighborhoods in favor of constructing new infrastructure for new development. Communities can help attract private sector investment in an existing neighborhood by maintaining and updating existing infrastructure.
Communities can employ a "fix-it-first" approach to infrastructure spending in order to help existing places thrive. A fix-it-first approach means that communities will prioritize public funding to repair, restore, and conduct preventive maintenance on existing infrastructure, including buildings, roads, and water and sewer lines, before building new infrastructure. This approach can encourage and attract development in areas that are already served by existing infrastructure, making existing communities more vibrant and saving on future maintenance costs.
Buildings can also be an issue for existing neighborhoods. Many older neighborhoods have unoccupied buildings that were built for a specific purpose that is no longer economically viable. These vacant spaces can be an excellent opportunity for adaptive reuse. Communities can invest in adapting these older buildings for a new modern use while preserving a historical asset for the community.
Communities can revitalize older, traditional business districts by encouraging historic preservation. Well-preserved private homes, examples of rural traditions such as barns, or important downtown
structures enable both residents and visitors to feel a sense of place. Federal and state tax credit programs facilitate diverse preservation efforts. The Main Street Four-Point Approach of the National Trust for Historic Preservation provides a useful framework for redevelopment efforts, specifically in older downtowns. This approach focuses on strategically combining historic preservation efforts with marketing the businesses in historic downtown areas as a way to generate additional economic investment. The strategy embraces distinctive architecture, fosters a pedestrian-friendly environment, promotes local business ownership, and creates a sense of community.
Protect Open Space and Working Lands – Rural communities are integrally linked with their surrounding landscapes. Growth in rural areas requires that communities preserve the landscapes that community members say they value. These include farmland, forests, and natural areas—the elements that are part of the sense of place for rural communities. These uniquely rural resources are best protected when there is a supportive economic climate that values working lands and a development climate that promotes the conservation of the natural landscape. Land development and population growth are signs of economic progress in many communities, but these indicators are often at odds with the working farms, natural landscapes, and scenic vistas that characterize rural areas and define their sense of place. When the agricultural, forest, and amenity-driven economies are encouraged to prosper, there is less pressure to convert land to developed uses in a haphazard manner. With strategic and early planning, a community can prioritize which land is most important to conserve and which land can accommodate the projected need for future growth.
Identify Appropriate Areas for New Growth – New growth is necessary for the continued economic development of a community. However, as we have explored in this chapter, location and type of growth are very important to future quality of life and economic success of a community. The Smart Planning Consortium has developed a Land Suitability Analysis and Future Land Use Maps to help communities plan for new growth. The Land Suitability Analysis (LSA) is a technical tool that uses existing data to estimate the most appropriate areas for new development. The Future Land Use Maps use information from the LSA and input from community members to create a plan for the future development of their community.
Land Use
Land Suitability Analysis – To aid in the future land use planning process, the Consortium conducted a Land Suitability Analysis. The objective of the LSA was to use a Geographic Information Systems (GIS) overlay analysis to identify appropriate areas for new development based on several factors. The overlay analysis uses mathematical processes to apply a common set of values to diverse and dissimilar inputs to create an integrated analysis.
Factors used in the analysis were:
- Avoid Steep Slopes
- Avoid High Value Agricultural Land
- Build Near Existing Highways
- Build Within Existing City Limits
- Avoid 100 Year Flood Plain
- Avoid Parks and Conservation Areas
The results of the overlay analysis displayed in Map 12.4. Based on the factors included in the analysis, areas shaded green are considered more appropriate for new development than areas shaded in red. The LSA was used as a reference tool during the creation of future land use maps.
Future Land Use Maps
The Dubuque Smart Planning Consortium developed future land use maps for the member cities and the full county. The purpose of the maps is to help guide future development within the region. Initial public input on the maps was taken during a series of meetings held in November and December of 2012. Following the initial public meeting the consortium created draft maps. Draft maps were presented to the cities for revisions, and the final maps were approved by each city council and the County Board of Supervisors. Maps 12.5 – 12.12 represent the existing land use conditions. Maps 12.13 – 12.20 represent the future land use maps created through the public input process.
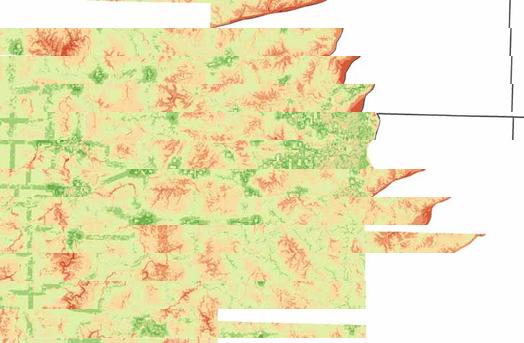
Map 12.4 - Land Suitability Analysis
Data: Iowa DNR, Dubuque County, Iowa DOT.
Goals and Objectives
- To keep the Land Use Plan and Future Land Use Map current with changing growth conditions in the region.
- Review the Land Use Plan and Future Land Use Map at five year intervals to ensure these planning documents remain useful guides for growth and development.
- Consider prompt review and possible amendment of the Land Use Plan and Future Land Use Map between five year intervals should development conditions significantly change.
- Integrate pertinent development data into Geographic Information Systems to expand and keep current on-going development trend analysis for planning purposes.
- Adopt or amend zoning, subdivision, flood plain, and health regulations necessary to fully implement the goals, objectives, and policies of the adopted Dubuque County Regional Comprehensive Plan.
- To plan for the future and orderly development within a regional context.
- Consider the regional setting and economy when assessing the opportunities and constraints for land development.
- Encourage intergovernmental partnerships to minimize the negative impact of city/county urban fringe development on regional watersheds, ecosystems, and rural infrastructure through compact and contiguous development with storm water management.
- Encourage intergovernmental cooperation to develop policies for development of fringe areas, to enhance development, and avoid unregulated sprawl.
- Promote corridors of green along natural and roadway corridors.
- Encourage cooperative regional planning with all levels of government, to develop a strategic plan for fringe area development that may include annexation.
- Encourage local governments to establish mutual agreements to plan, facilitate, coordinate, and resolve possible conflicts of proposed development within municipal fringe areas.
- Initiate a process with local governments to establish mutual fringe area planning and development agreements.
- Recognize that transportation and land use are directly related, and encourage appropriate land use and transportation planning.
3. To protect and enhance the viability, livability, and affordability of residential neighborhoods, while integrating multifamily development throughout the region.
- Promote inclusive and economically integrated neighborhoods that allow a diverse mix of residents and housing types.
- Promote providing a range of housing options throughout the region.
- Encourage connecting and interrelating neighborhoods with greenbelts or other pathways, commercial nodes, or public facilities.
- Encourage preservation of historic and aesthetic character and function of established neighborhoods.
- Encourage protection of existing residential areas from encroachment by incompatible development and land uses.
- Support providing neighborhood amenities throughout the region in an equitable manner.
- Encourage neighborhood identity, planning, and pride of place.
- Support preservation of the environmental quality of residential areas and buffer from noxious or nuisance impacts.
- Support protection of historic neighborhoods from inappropriate development, inconsistent with existing historic development.
- Continue to promote affordable housing for those who would like to purchase a home, but do not qualify for assistance.
4. Ensure that opportunities for convenient and concentrated commercial development are provided to support both the local and regional market.
- Support protection of downtown commercial districts and encourage continued reinvestment and redevelopment.
- Encourage expansion of commercial opportunities in existing commercial corridors or nodes where infrastructure can support growth.
- Promote opportunities for neighborhood commercial centers that assure compatibility with residential property.
- Support preservation of historic and aesthetic character and function of established commercial districts.
- Encourage mixed use development in the downtown area and unincorporated villages.
5. Provide sufficient opportunities for industrial development sites within the community.
- Promote the retention and expansion of existing, and attraction of new, industrial development opportunities in suitable locations.
- Support protecting existing industrial development from encroachment by incompatible development.
- Support annexation of land suitable for industrial development if necessary.
- Lessen negative impacts to residential areas which are located near industrial areas.
6. To balance open space and environmental preservation with the community's development needs.
- Encourage protecting and preserving existing open space and park land to meet the region's needs.
- Encourage expansion of urban green spaces in suitable locations to encourage livability and enhance aesthetics.
- Encourage parks, green space, trails, and similar park/open space uses easily accessible to residents at neighborhood level.
- Provide common open/green space and landscaping into all new development wherever possible.
- Support management of development along bluff lines and protect scenic vistas.
- Support protection of undeveloped and underdeveloped remaining land along blufflines.
- Support protection and enhancement of riverfront, wetlands, waterway corridors, floodplains, and other sensitive land areas.
7. Ensure that the physical character and form of the region reflects its historic setting and that the built environment is compatible with the natural environment.
- Consider defining and enhancing gateways and focal points to create a sense of place.
- Promote protection and preservation of historic buildings, urban pattern, and natural environment.
- Promote quality in the design and construction of new public and private development.
- Preserve natural areas and wildlife corridors that contribute to the character of the area.
8. Encourage the concept of mixed-use development to create diverse and self-sufficient neighborhoods.
- Promote a compatible mix of land uses that create a diversified urban environment that mixes shopping, employment, recreation, and residential opportunities where appropriate.
- Promote buffering and protecting of incompatible uses from each other.
- Consider limiting sprawl and aggregate travel time through use of mixed-use developments.
- Promote incentives to bring mixed-use to downtown and commercial districts.
- Encourage a mix of residential, commercial and retail uses for new developments that does not demarcate boundaries between residential and those commercial/retail uses that provide less intense, basic services for the neighborhood.
- Encourage design review to address how mixed-use developments are treated and to require quality development, so they become more acceptable to developers and business owners and more sensitive to neighborhood concerns/impacts.
- Encourage developers to create mixed-use developments and mixed-use regulations, including architectural designs for new commercial uses (buildings, signs, parking) that do not allow franchises to dictate architecture, signs, and parking lot designs.
9. To encourage redevelopment opportunities within the region in an effort to revitalize unused or underused property while promoting the preservation of viable and affordable housing stock.
- Encourage redevelopment or adaptive reuse of vacant or underutilized buildings and sites.
- Promote in-fill development, where appropriate, to encourage more compact urban form and avoid needless and costly sprawl while providing appropriate parking levels.
- Promote development and redevelopment that maximizes existing infrastructure.
- Strive to eliminate slum and blight.
- Promote affordable commercial space for small start-up, new, or growing businesses.
- Encourage reinvestment in our existing neighborhoods (i.e., smart growth).
10. To provide physical accessibility throughout the region.
- Encourage and facilitate accessibility by walking, cycling, and/or public transit.
- Encourage new development concepts that, by design, enable people to walk to work, school, day care, shopping, and recreation.
- Facilitate, where possible, enhanced accessibility within existing development.
- Encourage the development of pathways that link the region together in a cohesive manner.
- Assure the provision of access to persons with disabilities.
11. To promote principles of good urban design as part of all development.
- Create a balanced pattern of related urban land uses.
- Ensure that adjacent land uses are compatible with regard to such factors as smoke, noise, odor, traffic, activity, and appearance.
- Develop land that will be compatible with state lands and institutions.
- Provide adequate amounts of land in a variety of sites suitable for each type of urban use, and allow for anticipated change and growth based on economic forecasts.
- Utilize land that is adequately drained, relatively free of shallow bedrock, and reasonably level for urban purposes.
- Provide adequate water supply and sanitary waste disposal to developed areas.
- Build on soils that have adequate bearing capacity and are suitable for excavation and site preparation as much as possible.
- Support enhancement of the aesthetics of new and existing development -- design, landscaping, parking, signage -- with special sensitivity to the historic character and building materials found in the community.
- Encourage environmentally compatible and sensitive design that fits the development site.
- Promote energy conservation efforts in building design, materials, and orientation.
- Promote land conservation practices in density and building patterns to encourage compact urban form versus sprawl.
- Encourage flexible development that promotes commercial development to meet community design standards instead of developers dictating design.
- Promote land use controls to fit the various historic development patterns and neighborhoods that reflect urban, suburban, and rural characteristics.
- Strive to create and redevelop buildings which compliment the size and style of surrounding buildings.
Map 12.5 - Dubuque County Existing Land Use
Map 12.6 - City of Asbury Existing Land Use
Map 12.7 - City of Cascade Existing Land Use
Map 12.8 - City of Dubuque Existing Land Use
Map 12.11 - City of Farley Existing Land Use
City of Farley
Existing Land Use
Land Use: Agricultural Industrial Commercial Office Single Family Residential Multi Family Residential Mixed Use Institutional Park Open Space
Data: City of Farley, Dubuque County, 2012
Map 12.12 - City of Peosta Existing Land Use
City of Peosta
Existing Land Use
Land Use: Agricultural Industrial Commercial Office Single Family Residential Multi Family Residential Mixed Use Institutional Park Open Space
Data: City of Peosta, Dubuque County, 2012
Map 12.13 - Dubuque County Future Land Use
Map 12.14 - City of Asbury Future Land Use
Map 12.15 - City of Cascade Future Land Use
Map 12.16 - City of Dubuque Future Land Use
Map 12.17 - City of Dyersville Future Land Use
Map 12.18 - City of Epworth Future Land Use
Land Use
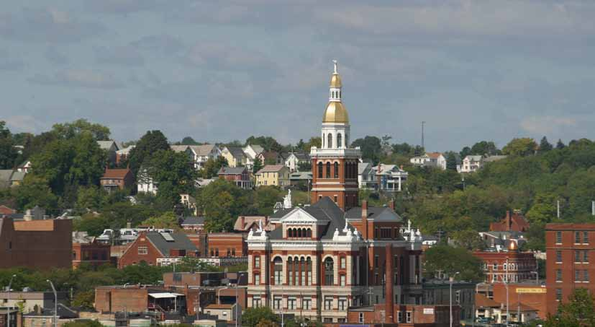
Intergovernmental Collaboration
Chapter 13
The success of the Comprehensive Plan will rely on the ability of individual communities to come together as a region to achieve a common goal. Historically, the communities in Dubuque County have a good working relationship. Dubuque County communities are able to cooperate to complete projects of mutual interest. Communities also work together to share information, resources, and are active in several regional organizations. However, communities could also be taking advantage of many opportunities for collaboration in economic development, environmental and agricultural protection, and resource sharing. This chapter will outline current collaboration efforts within the county and profile several regional organizations that facilitate collaboration. The chapter will also discuss past conflicts between Dubuque County municipalities and identify opportunities for collaboration. Recommendations included in this chapter will allow communities to prevent and resolve conflicts and help all Dubuque County communities continue to work together to achieve their goals for the future.
Benefits of Collaboration
Dubuque County communities have taken advantage of the many benefits of strong regional partnerships and intergovernmental collaboration. Some of the benefits of intergovernmental collaboration include:
Cost Savings - Cooperation can save money by increasing efficiency and avoiding unnecessary duplication. Cooperation can enable some communities to provide their residents with services that would otherwise be too costly. Examples include shared library services, police and fire protection, recycling of household hazardous waste, and shared government buildings (such as shared community center).
Address Regional Issues - By communicating and coordinating their actions, and working with regional and state agencies, local communities are able to address and resolve issues which are regional in nature. Examples include the construction and maintenance of highways, provision of transit service, and planning and construction of facilities for stormwater management and water supply.
Early Identification of Issues - Cooperation enables jurisdictions to identify and resolve potential conflicts at an early stage, before affected interests have established rigid positions, before substantial funds have been expended, before the political stakes have been raised, and before issues have become conflicts or crises.
Reduced Litigation - Communities that cooperate may be able to resolve issues before they become mired in litigation. Reducing the possibility of costly litigation can save a community money, as well as the disappointment and frustration of unwanted outcomes.
Consistency - Cooperation can lead to consistency of the goals, objectives, plans, policies, and actions of neighboring communities and other jurisdictions.
Predictability - Jurisdictions that cooperate provide greater predictability to residents, developers, businesses, and others. Lack of predictability can result in lost time, money, and opportunity.
Understanding - As jurisdictions communicate and collaborate on issues of mutual interest, they become more aware of one another's needs and priorities. They can better anticipate problems and work to avoid them.
Trust - Cooperation can lead to positive experiences and results that build trust and good working relationships between jurisdictions.
History of Success - When jurisdictions cooperate successfully in one area, the success creates positive feelings and an expectation that other intergovernmental issues can be resolved as well.
Service to Citizens - The biggest beneficiaries of intergovernmental cooperation are citizens for whom government was created in the first place. They may not understand, or even care about, the intricacies of a particular intergovernmental issue, but all residents can appreciate their benefits, such as cost savings, provision of needed services, and a strong economy.
Current Collaboration
Local governments in Dubuque County are constantly working together and with regional, state, and federal government agencies to provide the highest level of service to their citizens.
Intergovernmental Agreements
Dubuque County communities work together using a combination of formal and informal agreements to provide services to their citizens. Formal municipal agreements are generally referred to as 28E agreements as they are permitted under chapter 28E of the Iowa Code. The chapter permits “state and local governments in Iowa to make efficient use of their powers by enabling them to provide joint services and facilities with other agencies and to co-operate in other ways of mutual advantage.”1 Examples of 28E agreements in Dubuque County include:
Catfish Creek Watershed Management Authority –
The CCWMA’s mission is to improve water quality, reduce water quantity, promote groundwater recharge, and to protect, promote, and preserve groundwater resources within the watershed. CCWMA members include Dubuque County; and the cities of Dubuque, Asbury, and Centralia; and the Dubuque Soil and Water Conservation District.
Mutual Aid Agreements – Mutual aid agreements provide the procedures for sharing of resources between communities. Communities in Dubuque County have entered into agreements for sharing fire response, ambulance services, law enforcement, and criminal investigations. The Dubuque County Emergency Management Agency is responsible for establishing local mutual aid arrangements, and coordinates with Iowa Homeland Security and Emergency Management to ensure emergency management and response for communities is adequately planned and is well-equipped, trained, and exercised.
Communities in Dubuque County also have mutual aid agreements for maintaining transportation and other public works facilities. These 28E agreements define responsibilities for road maintenance, public transportation, landfill operation and maintenance, and building and facilities maintenance, among others.
The above list represents a small selection of the active 28E agreements in Dubuque County. The Iowa Secretary of State maintains an online database of 28E agreements. The database can be used to find information on 28E agreements between local governments in Dubuque County. The database is located at: http://sos.iowa.gov/28E/Controller.aspx?cmd=SOSSearch.
Informal Collaboration
In addition to formal 28E agreements, communities in Dubuque County also work together through a variety of informal agreements and community organizations. The Greater Dubuque Development Corporation (GDDC) has made a commitment to working with all communities in Dubuque County. GDDC has been especially helpful in working with smaller communities to attract prospective employers, coordinate infrastructure improvements, and finance projects through programs such as Tax Increment Financing. Many communities also participate in inter-community recreation activities. For example, Dyersville has youth baseball, softball, and soccer leagues that include players from the western half of the county. Communities also meet to cooperate and share ideas. Dubuque County city clerks meet quarterly to discuss city issues and learn about new programs. Communication between city clerks leads to sharing and trust between communities involved.
1 Iowa Code Chapter 28E.1.
in Dubuque County also work together through a variety of informal agreements and community organizations. The Greater Dubuque Development Corporation (GDDC) has made a commitment to working with all communities in Dubuque County. GDDC has been especially helpful in working with smaller communities to attract prospective employers, coordinate infrastructure improvements, and finance projects through programs such as Tax Increment Financing. Many communities also participate in inter-community recreation activities. For example, Dyersville has youth baseball, softball, and soccer leagues that include players from the western half of the County. Communities also meet to cooperate and share ideas. Dubuque County city clerks meet quarterly to discuss city issues and learn about new programs. Communication between city clerks leads to sharing and trust between communities involved.
Regional Organizations
ECIA
The East Central Intergovernmental Association is a membership sponsored organization of local governments in Cedar, Clinton, Delaware, Dubuque, and Jackson counties. Cooperative effort, through ECIA membership, provides greater resources to local governments than they would be able to afford individually. The sharing of resources and discussion of common concerns vastly improves the quality and consistency of solutions to local and regional problems. Costs are held at a level that allows all local governments in the region to participate.
ECIA provides numerous planning, technical, and management resources to assist local governments in reaching and implementing decisions. Services provided by ECIA cover six broad categories: Community Development, Economic Development, Transportation Planning, Housing Assistance, Employment and Training, and Rural Transit Services.
Transportation
The Dubuque Metropolitan Area Transportation Study (DMATS) and Regional Planning Affiliation 8 (RPA 8) are regional agencies that plan for the future of the regional transportation network. Both agencies are led by policy boards that are made up of representatives from local governments. Policy board members work together to allocate funding to projects that will help maintain and improve the regional transportation system.
Smart Planning Consortium
The Smart Planning Consortium is a regional organization in Dubuque County that was created to develop this plan. After the completion of the Comprehensive Plan, the Smart Planning Consortium will continue to exist and will remain active in the County. The primary objectives of the Consortium will be to ensure the implementation of the Comprehensive Plan and see that the members review and revise the plan as necessary. The Consortium will also serve as a facilitator for collaboration between communities. Communities will meet to discuss issues and identify potential areas for collaboration on regional and local projects. For example, planning improvements for Heritage Trail is a large-scale project that would benefit many communities across the region and would require regional coordination. A Main Street program is a local project, but many communities may have similar programs and could share resources and provide advice on how to improve their downtowns. Communities could also participate in regional efforts to promote local tourist attractions in a regional context.
Conflicts
Dubuque County communities work together to provide the best services possible to their citizens; however, conflicts between communities have arisen in the past. Land use and land development issues can be the cause of conflicts between municipalities. Land is an essential commodity for community growth and is in limited supply. The result can be a competitive atmosphere that can result in conflict. For the most part, Dubuque County communities take a cooperative approach to new development, but land use development conflicts have occurred between cities and Dubuque County in various ways and intensities. This section discusses some of the conflicts that have occurred and provides methods for improving conflict resolution within the County.
City-County Conflicts
Conflicts between cities and the County can stem from rural developments outside of communities in the unincorporated area of the county. When developments are approved just outside of incorporated cities, communities can miss out on opportunities to use their excess utility capacity and expand their tax base. New residents may also increase demand on public facilities such as city streets, parks, and pools without contributing to the full expenses of these facilities. Greater traffic volumes on city streets will hasten roadway deterioration and require the addition of traffic control devices, all of which increases the communities' expense with little return through municipal property taxes or fees.
192
Intergovernmental Collaboration
Map 13.1 - Extraterritorial Subdivision Review Boundaries
in the unincorporated area of the county. When developments are approved just outside of incorporated cities, communities can miss out on opportunities to use their excess utility capacity and expand their tax base. New residents may also increase demand on public facilities such as city streets, parks, and pools without contributing to the full expenses of these facilities. Greater traffic volumes on city streets will hasten roadway deterioration and require the addition of traffic control devices, all of which increases the communities' expense with little return through municipal property taxes or fees.
There are also rural development situations adjacent to a city boundary, when the County assumes that the city would automatically annex the area following development. Such annexations do occur occasionally, but just as often, they do not because the city does not have any extra utility capacity or cannot afford to extend utility lines, or the development does not meet city standards.
Extraterritorial Jurisdiction
- City Corporate Limits
- City Extraterritorial Jurisdiction
- Overlapping ETJs
Source: Dubuque County
Iowa Code gives cities that have adopted subdivision ordinances the option to review subdivision plats that are within two miles of their city’s boundaries. Fifteen cities in Dubuque County have adopted a subdivision review ordinance for this two-mile extraterritorial jurisdiction (ETJ). The County notifies these fifteen cities about subdivision applications within their ETJ area. The County does not notify cities that have not adopted ETJ about subdivision plats and new developments.
City–City Conflicts
Annexation is an issue that has created conflicts between cities all over the United States. Cities annex land to provide space for new development. As a city grows it may find itself in competition with another city over a parcel of land. In Dubuque County, the boundaries Asbury, Dubuque, and Sageville are directly adjacent, and several other cities are separated by less than two miles. Annexation conflicts in Dubuque County have not risen to the extreme levels seen in other communities, but as cities continue to expand there is an added potential for conflict.
Development conflicts between cities can also occur in unincorporated areas that are under a city’s extraterritorial subdivision review jurisdiction (ETJ). Several communities within the county have overlapping ETJ subdivision review boundaries. Development conflicts between cities can arise in these overlap areas. Cities with overlapping subdivision review boundaries can establish mutual subdivision regulations through a 28E intergovernmental agreement with each other and/or the County. If no agreement is in place, then the city that is closest to the boundary of the subdivision shall have authority to review the subdivision. Currently, no cities in Dubuque County have ETJ subdivision review agreements in place. Map 13.1 highlights the overlapping ETJ mile subdivision review boundaries within Dubuque County.
Resolving Conflicts
If conflicts do occur, communities may use a dispute resolution process that provides a low-cost, flexible approach to resolving conflicts. The process works to resolve actual and potential conflicts between governmental entities through open dialog and cooperative initiatives. The principal benefits of government entities utilizing an alternative dispute resolution process to resolve conflicts include:
- Saving time and legal expenses.
- Having greater control over the dispute resolution process.
- Resolving conflicts in a more creative way than might be possible if left to a decision by a judge or jury.
- Greater privacy in resolving disputes than is afforded in a courtroom.
- Responding to conflict in a rational and courteous manner can increase communication, foster positive intergovernmental relationships, provide an opportunity for learning, and broaden perspectives and solutions.
Figure 13.1 - Dispute Resolution Ladder
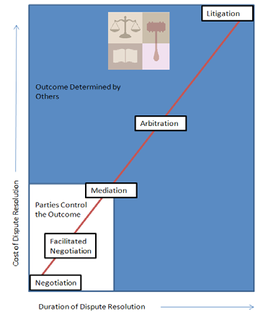
Figure 13.1 shows an example of a dispute resolution process. The intent of the process is to resolve as many conflicts as possible at the lowest steps on the ladder. If the dispute is not resolved at the lower stages, the dispute moves up the ladder. It is in the best interest of all parties involved to resolve the dispute at the lower stages on the ladder, as both the cost and duration of the process increase at the higher stages and the involved parties have less control over the outcome.
Preventing Conflicts
In most cases, communities can avoid conflicts by establishing agreements and developing consistency in their local policies. Working closely with other communities will help all parties involved identify and resolve potential conflicts at an early stage, before affected interests have established rigid positions, before the political stakes have been raised, and before issues have become conflicts or crises.
Municipal Agreements
Currently, land development conflicts are resolved as they arise, but this process can be highly contentious and does not always produce the most efficient results. Communities can avoid these issues by entering into agreements that will improve the land development process and provide the best opportunity for orderly planning, development, and the provision of municipal services.
Communities can prevent many annexation conflicts by establishing an annexation agreement before problems arise. Under the agreement, both sides delineate future annexation areas for each community and agree to annex only the land within their area. The agreement can also lay out easement agreements for future utility extensions.
Communities can also use 28E agreements to eliminate extraterritorial subdivision review conflicts by creating an agreed upon set of subdivision regulations to be used in the ETJ overlap zone. Communities can also establish a boundary that delineates areas where each community has subdivision review authority. A subdivision review agreement can be done as part of an annexation agreement or as a standalone agreement.
Source: Washington County, WI Comprehensive Plan: 2035
Annexation and subdivision review agreements can avoid conflicts and can help expedite the subdivision approval process by eliminating the need for ad hoc negotiations between cities. Agreements between cities will also make the subdivision review process easier for the county. Subdividers will know which city's regulations they will need to meet based on a map with clearly defined annexation and subdivision areas. Overall, the agreements can provide added clarity and predictability to the land development process.
Development Codes
Zoning, subdivision, and building codes, or development codes, are important tools that provide communities with the opportunity to establish land use patterns that are logical, orderly, attractive, and convenient. Carefully planned and thoughtfully developed communities are instantly recognizable, as private investment is encouraged and protected in such environments. Similarly, public resources can be expended more efficiently as a result of sound planning enforced by effective development codes. Development codes will be a key part of the implementation of the Comprehensive Plan. Implementation through development codes is vital because the Comprehensive Plan on its own has no legal authority.
Currently, zoning, subdivision, and building codes and the process required to comply with these codes vary greatly across municipalities within Dubuque County. Differences in these development codes can be very confusing for builders and developers, and can also promote urban sprawl by allowing developers to leapfrog into unincorporated areas with less restrictions on development.
Regional implementation of development codes can address some of these issues. While the codes and processes are different, the intent behind most of them is very similar. If the cities and the County adopt similar development codes, local governments will be on an equal playing field, which will limit instances of development jumping into rural areas to avoid regulation. Regional code implementation will also encourage new economic development by reducing the complexity of subdividing and building
Intergovernmental Collaboration
in Dubuque County by establishing similar codes across the county. Development codes can benefit smaller communities that do not have the means to administer and enforce a code. Smaller communities with similar codes could pool their resources to share the burden of code compliance.
Goals and Objectives
- Improve relationships among local governments within the region by strengthening communication and identifying opportunities for sharing information.
- Promote better understanding among all levels of government on the roles and responsibilities of each.
- Formally invite groups, agencies, or entities to public meetings where the topics discussed are of known importance to the invitee.
- Encourage communities to become/remain active on regional committees and boards.
- Encourage communities to communicate development proposal details to surrounding jurisdictions on a timely basis.
- Reduce land use conflicts between neighboring jurisdictions including issues concerning annexations, urban and rural development, code compliance, and fringe area development.
- Establish fringe area development agreements to resolve conflicts between cities and the county.
- Establish fringe area development agreements to resolve conflicts between adjacent cities.
- Encourage local governments to adopt a rural model smart code that will promote consistency of development.
- Encourage cooperative land use policies that protect agricultural land and open space and allow for cost effective service delivery by encouraging new development to locate within existing cities and established urban fringe areas.
- Encourage Dubuque County communities to coordinate economic development efforts.
- Coordinate regional promotion of local tourist attractions.
- Coordinate local business recruitment and retention activities on a regional scale.
- Cooperate with local educational institutions to coordinate training/skill requirements to meet the needs of local employers.
- Plan for new and maintain housing, transportation, communication, and utility systems to foster walkable cities and promote economic development.
- Develop regional strategy to provide adequate supply of vacant, development-ready land for residential, commercial, and industrial use in each community.
- Cooperate with businesses, educational institutions, community organizations, and governments to provide information to local businesses.
- Plan and promote multi-jurisdictional economic development projects that foster cooperation instead of competition.
- Encourage Dubuque County communities to coordinate the planning, programming, and use of personnel, equipment, services, facilities, and infrastructure.
- Cooperate with businesses, educational institutions, community organizations, and governments to identify and pursue federal, state, and private funding to help accomplish region-wide goals.
- Encourage development to locate within existing cities and establish urban fringe areas where adequate public utilities are planned or can be provided.
- Promote the integration of sound, affordable housing throughout the region.
- Encourage local government participation in school district site selection and facilities planning efforts.
- Continue to work with DMATS, RPA8, and Iowa DOT to plan for transportation infrastructure expansion and maintenance.
- Encourage intergovernmental coordination when selecting sites for community facilities,
such as police stations, fire stations, administration buildings, libraries, hospitals, and schools.
- Coordinate regional agriculture and natural resource protection efforts.
- Cooperate on regional stormwater management planning, education, and enforcement of stormwater and erosion control ordinances.
- Coordinate regional efforts to improve air quality by reducing emissions from both point and nonpoint sources.
- Promote the protection, preservation, and enhancement of the region’s bluffs, prairies, wetlands, waterways, scenic views, vegetation, wildlife, and all natural areas.
- Promote watershed planning to improve water quality and mitigate flooding.
- Preserve prime agricultural land using infill development, brownfield redevelopment, and sensible agriculture preservation policies.
- Continue the dialog on comprehensive planning, land use regulation, and boundary issues between local governments in Dubuque County.
- Work cooperatively with local municipalities to make revisions to zoning, subdivision, building, and other municipal codes to implement the recommendations of the Comprehensive Plan.
- Continue regular meetings of the Dubuque Smart Planning Consortium after the completion of the Comprehensive Plan.
- Review Comprehensive Plan bi-annually and update the plan in a timely manner.
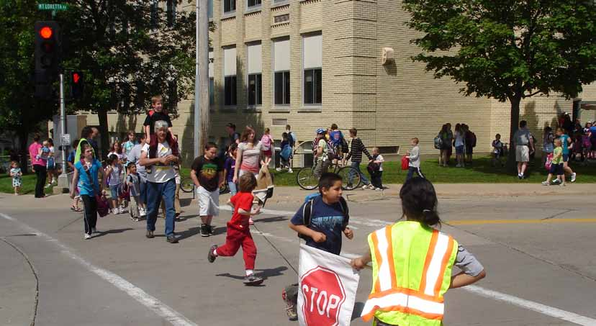
Chapter 14
Many of the problems facing Dubuque County are not new. Issues including urban sprawl, farmland preservation, and affordable housing were identified in the region's first comprehensive plans that were published in the 1960s. The fact that many of the same issues persist today demonstrates the complexity of these problems, but it also indicates that while many of these issues have been included in plans, they have not filtered into community budgets, capital improvement plans, and zoning and building codes. The intent of a comprehensive plan is to cast a wide net and touch on all topics relevant to the future development of the community. On its own, a comprehensive plan has no legal authority, it is merely an agreed upon road map for the future of the community. To achieve its goals, a community must actively work to incorporate the recommendations of the comprehensive plan into its budgets, policies, and ordinances.
The Smart Planning Consortium has identified seventeen projects that will put the goals and objectives of the Comprehensive Plan into practice. The recommended projects are listed on the following pages. Each project has a table that identifies the project name, the party responsible for completing the project, and a general timeline. Project timelines have been classified as short-term (less than one year), medium-term (one to five years), and long-term (more than five years). Projects with an ongoing timeline are those projects without a specific end date. Following the table, a brief description of the project is included. Projects are not ranked or listed in any specific order.
| 1. Multi-Jurisdictional Hazard Mitigation Plans | ||
|---|---|---|
| Responsible Parties | Elements | Time |
| Cities | Hazard Mitigation | Ongoing |
| County | Intergovernmental Coordination | |
| Watershed | ||
| Public Participation | ||
The Dubuque County Multi-Jurisdictional Hazard Mitigation Plan (MJHMP) provides the basic Hazard Mitigation strategy for all municipalities in Dubuque County. Through the MJHMP, communities identify hazards, analyze the risk associated with each hazard, and estimate the community’s vulnerability to each hazard. Communities then develop a list of projects that will mitigate the risk from hazards and prepare the community to take action in the event of an emergency. The communities should continue to update Dubuque County MJHMP and implement mitigation projects through their land use plans and capital improvement budgets.
| 2. Maintain and Update Comprehensive Plan | ||
|---|---|---|
| Responsible Parties | Elements | Time |
| Cities | Intergovernmental Coordination | Ongoing |
| County | Issues and Opportunities | |
| Smart Planning Consortium | Public Participation | |
The Comprehensive Plan is intended to guide regional development over the next 20 to 30 years. For the plan to remain relevant, it must be reviewed and updated periodically to reflect the changing conditions in the region. The Consortium should develop a process to evaluate and update the information provided in the plan. The Consortium should also provide status reports to the region.
| 3. | Strategic Planning for Economic Development | |
|---|---|---|
| Responsible Parties | Elements | Time |
| Cities | Intergovernmental Collaboration | Ongoing |
| County | Implementation | |
| Smart Planning Consortium | ||
Regional collaboration is vital to the economic success of the region. In Dubuque County, regional economic development is guided by the Comprehensive Economic Development Strategy (CEDS). The CEDS is produced by the East Central Intergovernmental Association (ECIA) and includes Cedar, Clinton, Delaware, Dubuque, and Jackson counties. The goal of the CEDS is to coordinate economic development activities in the region. ECIA provides assistance to local governments, development corporations, chambers of commerce, businesses, and individuals in the ongoing implementation of the CEDS. Communities should actively participate in the development of the CEDS, and work to implement the goals and objectives of the CEDS on both local and regional levels.
199| 4. DMATS and RPA 8 Long Range Transportation Plans | ||
|---|---|---|
| Responsible Parties | Elements | Time |
| Cities | Transportation | Ongoing |
| County | Economic Development | |
| DMATS | Intergovernmental Coordination | |
| RPA 8 | Public Participation |
Project Description
A long-range transportation plan (LRTP) focuses on transportation related issues in a specific area over a 20-year period. The DMATS plan covers the Dubuque metropolitan area including the cities of Dubuque, Asbury, and Peosta. The RPA 8 plan includes rural areas and incorporated cities in Clinton, Delaware, Dubuque, and Jackson counties. The primary objective of the LRTPs is to set the long-term transportation priorities for the region. The plans provide a view of the current transportation trends in the region and aid in projecting potential changes for the area into the future. As members of DMATS and RPA 8, communities should work together to connect the goals and objectives of the Comprehensive Plan and both LRTPs.
| 5. Catfish Creek Watershed Management Plan | ||
|---|---|---|
| Responsible Parties | Elements | Time |
| Cities | Watershed | Medium |
| County | Hazard Mitigation | |
| Dubuque SWCD | Agriculture and Natural Resources | |
| CCWMA | Land Use |
Project Description
The Catfish Creek Watershed Management Authority (CCWMA) was established in the summer of 2012 to tackle concerns with water quality and flooding on a watershed level. The CCWMA seeks to promote working together across jurisdictional boundaries to solve problems within the watershed. The CCWMA has been tasked with creating a Watershed Management Plan (WMP) for the Catfish Creek Watershed. A WMP uses a long-term, comprehensive approach to identify water quality problems, propose solutions, and create a strategy for putting these solutions into action.
| 6. Flood Plain Management Ordinances | ||
|---|---|---|
| Responsible Parties | Elements | Time |
| Cities | Watershed | Short-Term |
| County | Hazard Mitigation | |
| Dubuque SWCD | Agriculture and Natural Resources | |
| Catfish Creek WMA | Catfish Creek WMA |
Project Description
Protecting life and property from flood hazards is an important issue for the communities in Dubuque County. Communities can use a floodplain management ordinance to minimize losses due to flooding by limiting development in the floodplain, requiring structures in the floodplain to be protected from flooding, and protecting people from buying land which is unsuitable for development because of flooding. An adopted floodplain ordinance is required to be eligible for the National Flood Insurance Program and for certain types of State post disaster assistance. Many communities in the County have adopted and are enforcing floodplain management ordinances. The Consortium will encourage all communities in the region to adopt and enforce a floodplain management ordinance.
200
| 7. Zoning Code | Time | |
|---|---|---|
| Responsible Parties | Elements | Time |
| Cities | Community Character Public Participation | Medium-Term |
| County | Housing Land Use | |
| Smart Planning Consortium | Economic Development Hazard Mitigation Watershed |
Zoning ordinances are a primary tool for implementing a comprehensive plan. The adoption of the Regional Comprehensive Plan and subsequent local comprehensive plan updates may necessitate changes to local zoning ordinances. For example, the Comprehensive Plan recommends the use of mixed-use development to promote walkable, economically vibrant communities, but mixed-uses may be limited by traditional Euclidean zoning that separates different land uses. Communities can encourage mixed-uses by updating their zoning code using a form-based zoning approach that places more emphasis on design and density of new development rather than the traditional Euclidean zoning approach with its primary emphasis on separation of uses.
During summer 2012, the Consortium participated in the creation of the Dubuque County Rural Model Smart Code. The purpose of this project was to provide training in the use and establishment of a hybrid form-based code within the three pilot communities of Bankston, Durango, and Sageville, which can be replicated elsewhere within Dubuque County. Dubuque County communities can use the Dubuque County Rural Model Smart Code as a guide to implement changes to their own zoning codes.
| 8. Regional Sustainability Indicators | ||
|---|---|---|
| Responsible Parties | Elements | Time |
| Cities | Implementation | Short-Term |
| County | Public Participation | |
| University of Iowa | Intergovernmental Collaboration | |
| Smart Planning Consortium | Land Use |
The Consortium has established a partnership with the University of Iowa School of Urban and Regional Planning to create a set of regional sustainability indicators that will allow the Consortium to track the implementation of the Comprehensive Plan. As part of the University's “Iowa Initiative for Sustainable Communities”, graduate students will work to define the most important performance metrics for the region's Smart Planning Principles. The project will identify available data at the county-wide level, as well as local level data for smaller towns. Specifically, the project will seek to identify models for projecting land development needs in relation to population changes and job projections. Once complete, this project will provide the Consortium with a model for collecting data, measuring progress, and reporting that progress to the regional community.
| 9. Comprehensive Plan Updates | ||
|---|---|---|
| Responsible Parties | Elements | Time |
| Cities | Land Use | Medium-Term |
| County | Intergovernmental Coordination | |
| Issues and Opportunities | ||
| Public Participation |
Project Description
The Dubuque County Comprehensive Plan will establish a long-term vision for the region; however, the region is a collection of unique communities, and it is important for individual communities to establish their own vision for the future. During the local comprehensive planning process, community leaders will work with residents to describe community characteristics, establish goals and objectives, and explore alternative plans for the future. The community's legislative body will then adopt the comprehensive plan as a policy guide for future development. As part of the Comprehensive Planning Process, Consortium members have agreed to consider the goals and objectives of the Comprehensive Plan during their next comprehensive plan update.
| 10. Heritage Trail Plan | Responsible Parties | Elements | Time |
|---|---|---|---|
| Cities | Transportation | Short-Term | |
| County | Community Character | ||
| County Conservation | Agriculture and Natural Resources | ||
| Smart Planning Consortium | Public Participation Intergovernmental Coordination Economic Development |
Project Description
During the summer and Fall of 2012, the Consortium began work on a plan for the Heritage Trail with assistance from a Community Planning Assistance Team (CPAT) from the American Planning Association. The CPAT will offer the Consortium recommendations on how to make the trail more accessible and user friendly, how to promote the sustainability of the Trail, and how to expand the recreational and economic development opportunities of the entire region. To achieve the regional goals for the Trail, communities will need to work together to implement the plan's recommendations. The Consortium should also use the Heritage Trail project as a model for future region wide efforts in the County.
| 11. County Agriculture Exemption Process | ||
|---|---|---|
| Responsible Parties | Elements | Time |
| County | Agriculture and Natural Resources Land Use | Short-Term |
Project Description
Iowa Code Chapter 335.2 exempts farmland, farm houses, farm barns, farm outbuildings, or other buildings or structures which are primarily adapted for use for agricultural purposes from county Zoning Ordinances. This exemption is implemented individually by each county since the legislature has not defined a farm for zoning purposes and has not given counties any specific rules to follow. Dubuque County's agricultural exemption process does not do an adequate job of preserving the availability of agricultural land for farming purposes. The Dubuque County Zoning Office is working on establishing new rules and procedures to determine if an application for a structure or building meets the agricultural exemption and if not, that the new development adequately protects the availability of agricultural land for farming purposes.
202
| 12. Capital Improvement Program | ||
|---|---|---|
| Responsible Parties | Elements | Time |
| Cities | Public Infrastructure and Utilities | Medium-Term |
| County | Economic Development Community Facilities Transportation Public Participation | |
Project Description
Capital Improvement Programs (CIP) are short range plans, usually 5 to 10 years, that identify capital projects and equipment purchases, provide a planning schedule, and identify financing options. The CIP is very important for implementation because it essentially provides a link between the goals and objectives of a comprehensive plan and the municipality’s budget. To successfully implement the goals and objectives of the Comprehensive Plan, communities should consider the recommendations of the plan during their CIP process.
| 13. Main Street Approach | ||
|---|---|---|
| Responsible Parties | Elements | Time |
| Cities | Economic Development Community Character | Medium-Term |
Project Description
Sustaining local economies will be a challenge for Smart Planning Consortium members in the future. The Region’s Main Streets present an opportunity for new economic growth. The Main Street Four-Point Approach is an economic development tool used to revitalize downtown districts by leveraging local assets. The approach focuses on existing community assets such as architectural heritage, local enterprises, and community pride. The four points are organization, promotion, design, and economic restructuring. The City of Dubuque has had success using the Four-Point approach to revitalize its downtown area. Main Street concepts could be implemented in other communities to help sustain vibrant local economies.
| 14. Stormwater Management Ordinances | ||
|---|---|---|
| Responsible Parties | Elements | Time |
| Cities | Watershed | Medium-Term |
| County | Hazard Mitigation | |
| Dubuque SWCD | Land Use | |
| Intergovernmental Collaboration Issues and Opportunities Agriculture and Natural Resources | ||
Project Description
Preventing flooding and protecting water quality is an important challenge facing the Dubuque County Region. Some communities within the county have established new ordinances to protect their important water resources. Erosion control ordinances prevent erosion and sedimentation during construction or other land disturbing activities. Stormwater ordinances limit flooding post-development by requiring the installation of infiltration-based stormwater control. As of fall 2012, Dubuque County, the City of Dubuque, the City of Asbury, and the City of Epworth have adopted both Erosion Control and Stormwater Ordinances. Region-wide implementation of these ordinances is key to their success, as flooding and water quality issues do not stop at municipal boundaries.
203
| 15. Fringe Area Agreements | ||
|---|---|---|
| Responsible Parties | Elements | Time |
| Cities | Land Use | Medium-Term |
| County | Intergovernmental Collaboration Issues and Opportunities |
Project Description
Fringe Area Agreements are formal agreements between municipalities that address land development issues in unincorporated areas that are near city boundaries. Communities can use Fringe Area Agreements to establish an orderly transition from urban to rural land uses, to protect environmental resources by directing development to targeted growth areas, and to accomplish successful intergovernmental coordination. Fringe Area Agreements can improve the land development process and provide the best opportunity for orderly planning, development and the provision of municipal services.
| 16. Mississippi River Basin Initiative | ||
|---|---|---|
| Responsible Parties | Elements | Time |
| NRCS | Watershed | Long-Term |
| Dubuque SWCD | Agriculture and Natural Resources | |
| County | Hazards | |
| Intergovernmental Collaboration |
Project Description
The goal of the Mississippi River Basin Initiative (MRBI) is to reduce nutrient loading in the Mississippi River Basin, which contributes to both local water quality problems and the hypoxic zone in the Gulf of Mexico. Farmers in three subwatersheds covering sections of Dubuque, Delaware and Clayton Counties within the Maquoketa River Watershed have the opportunity to receive higher payment rates on conservation practices and systems that avoid, control and trap nutrient runoff; improve wildlife habitat; and maintain agricultural productivity. MRBI will be offered now through fiscal year 2013. To enroll, applicants must meet the minimum eligibility requirements of the Environmental Quality Incentives Program (EQIP). Eligible practices and payment rates are listed on the back page.
| 17. Building Codes | Elements | Time |
|---|---|---|
| Cities | Housing | Long-Term |
| County | Community Character Intergovernmental Collaboration |
Project Description
A building code is a set of rules that specify the minimum acceptable level of safety for constructed objects such as buildings. Building codes provide minimum standards to ensure the public safety, health and welfare and to secure safety to life and property from all hazards related to buildings. Building codes can also be a way for communities to incorporate green building techniques in their community. Building code administration is an opportunity for regional coordination to share the costs of implementation and enforcement, to protect health and safety of residents, and to protect property values.
List of Figures
Figure 2.1 - Smart Planning Elements and Principles 13
Figure 4.1 - Dubuque County School Enrollment 2011 43
Figure 4.2 - Dubuque County Fire Departments 46
Figure 4.3 - Dubuque County Emergency Medical Service Providers 47
Figure 5.1 - Schematic Diagram of a Typical Water Distribution System 60
Figure 5.2 - Schematic Diagram of a Wastewater Collection and Treatment System 62
Figure 5.3 - Residential Garbage and Recycling Collection Service Providers 63
Figure 5.4 - Dubuque County Telecommunications Service Providers 63
Figure 5.5 - Total Annual Property Tax 67
Figure 5.6 - Fuel Economy 68
Figure 5.7 - Property Tax Per Acre 68
Figure 6.1 - Miles of Roadway by Functional Classification 72
Figure 6.2 - Future Needs DMATS & RPA 77
Figure 6.3 - DMATS & RPA Annual Ridership 77
Figure 6.4 - Pedestrian Fatality Data (2000-2009) 79
Figure 6.5 - Freight Movement 81
Figure 6.6 - Total Operations 82
Figure 6.7 - Total Enplanements 82
Figure 7.1 - Dubuque County Historical Employment 96
Figure 7.2 - Annual Unemployment Rate 97
Figure 7.3 - Dubuque County Employment Forecast 97
Figure 7.4 - 2009 County Business Patterns* 98
Figure 7.5 - Total Primary Jobs by City 2009 99
Figure 7.6 - Gender Wage Gap 101
Figure 8.2 - Housing Appreciation Price Risk Index 113
Figure 8.1 - Dubuque County Housing Tenure 113
Figure 8.3 - Monthly Owner Costs as a Percent of HH Income 114
Figure 8.4 - Monthly Owners Costs as a percent of HH Income 114
Figure 8.5 - Gross Rent as a Percent of HH Income 114
Figure 8.6 - Dubuque County Combined Housing Costs 115
Figure 9.1 - Average Corn & Soybean Prices 126
Figure 9.2 - Historic Dubuque County Land Values 126
Figure 9.3 - Observed PM 2.5 129
Figure 10.1 - Emergency Management Plans and Responsible Agencies 138
Figure 10.2 - The Cycle of Emergency Management 139
Figure 10.3 - Hazard Analysis Risk Assessment Results For Countywide Hazards 140
Figure 10.4 - Hazard Priority Lists for Countywide Hazards 140
Figure 10.5 - Hazard Analysis Risk Assessments Results for Community Specific Hazards 141
Figure 10.6 - Top Hazard Mitigation Priorities 145
Figure 11.1 - The Hydrologic Cycle 154
Figure 11.2 - Impact of Impervious Area on the Hydrologic Cycle Fluxes 155
Figure 11.3 - Conservation Design Subdivision Layout 159
Figure 11.4 - Conservation Design Subdivision Layout Continued 160
Figure 11.5 - Comparing Conventional and Conservation Subdivisions 160
Figure 11.6 - Qualitative Cost Comparison – How LID Practices Compare with Conventional Practices 161
Figure 11.7 - Advantages and Disadvantages of Regional Stormwater Management Facilities
Figure 12.1 - City of Dubuque and Dubuque County Historical Population 170
Figure 12.2 - Dubuque County Model Transect 173
Figure 12.3 - Tax Revenue Per Acre 175
Figure 12.4 - Tax Revenue Per Acre 176
Figure 13.1 - Dispute Resolution Ladder 194
List of Maps
Map 4.1 - City of Asbury Community Facilities 56
Map 4.2 - City of Cascade Community Facilities 56
Map 4.3 - City of Dubuque Community Facilities 57
Map 4.4 - City of Dyersville Community Facilities 57
Map 4.5 - City of Epworth Community Facilities 58
Map 4.6 - City of Farley Community Facilities 58
Map 4.7 - City of Peosta Community Facilities 59
Map 5.1 - Maximum Advertised Download Speed 64
Map 5.2 - Iowa Utilities Board Electrical Service Areas 65
Map 5.3 - Building Starts 2000-2010 66
Map 6.1 - Dubuque County Level of Service 2010 73
Map 6.2 - Dubuque County Level of Service 2040 74
Map 6.3 - The Jule Transit Routes 75
Map 6.4 - RTA Transit Routes 76
Map 6.5 - Bike and Pedestrian Facilities 78
Map 6.6 - Dubuque County Federal Functional Classification 88
Map 6.7 - City of Asbury Federal Functional Classification 88
Map 6.8 - City of Cascade Federal Functional Classification 89
Map 6.9 - City of Dubuque Federal Functional Classification 89
Map 6.10 - City of Dyersville Federal Functional Classification 90
Map 6.11 - City of Epworth Federal Functional Classification 90
Map 6.12 - City of Farley Federal Functional Classification 91
Map 6.13 - City of Peosta Federal Functional Classification 91
Map 6.14 - Dubuque County Severe Roadway Crashes 92
Map 6.15 - City of Asbury Severe Roadway Crashes 92
Map 6.16 - City of Cascade Severe Roadway Crashes 93
Map 6.17 - City of Dubuque Severe Roadway Crashes 93
Map 6.18 - City of Dyersville Severe Roadway Crashes 94
Map 6.19 - City of Epworth Severe Roadway Crashes94
Map 6.20 - City of Farley Severe Roadway Crashes95
Map 6.21 - City of Peosta Severe Roadway Crashes95
Map 7.1 - Dubuque County Employment & Outflow 200999
Map 7.2 - Dubuque County Employment Density108
Map 7.3 - City of Asbury Employment & Outflow 2009108
Map 7.4 - City of Cascade Employment & Outflow 2009109
Map 7.5 - City of Dubuque Employment & Outflow 2009109
Map 7.6 - City of Dyersville Employment & Outflow 2009110
Map 7.7 - City of Farley Employment & Outflow 2009110
Map 7.8 - City of Epworth Employment & Outflow 2009111
Map 7.9 - City of Peosta Employment & Outflow 2009111
Map 9.1 - The Driftless Area123
Map 9.2 - Dubuque County Topography124
Map 9.3 - Dubuque County Land Cover125
Map 9.4 - Dubuque County Corn Suitability Rating125
Map 9.5 - New Non Agricultural Building Starts 2000-2010128
Map 10.1 - Dubuque County Flood Risk150
Map 10.2 - City of Asbury Flood Risk150
Map 10.3 - City of Cascade Flood Risk151
Map 10.4 - City of Dubuque Flood Risk151
Map 10.5 - City of Dyersville Flood Risk152
Map 10.6 - City of Epworth Flood Risk152
Map 10.7 - City of Farley Flood Risk153
Map 10.8 - City of Peosta Flood Risk153
Map 11.1 - Dubuque County Watersheds/Drainage Basins166
Map 11.2 - City of Asbury Watersheds/Drainage Basins166
Map 11.3 - City of Cascade Watersheds/Drainage Basins167
Map 11.4 - City of Dubuque Watersheds/Drainage Basins167
Map 11.5 - City of Dyersville Watersheds/Drainage Basins 168
Map 11.6 - City of Epworth Watersheds/Drainage Basins 168
Map 11.7 - City of Farley Watersheds/Drainage Basins 169
Map 11.8 - City of Peosta Watersheds/Drainage Basins 169
Map 12.1 - Population Per Square Mile 171
Map 12.2 - Jobs Per Square Mile 171
Map 12.3 - Dubuque County Annexations 171
Map 12.4 - Land Suitability Analysis 178
Map 12.5 - Dubuque County Existing Land Use 182
Map 12.6 - City of Asbury Existing Land Use 182
Map 12.7 - City of Cascade Existing Land Use 183
Map 12.8 - City of Dubuque Existing Land Use 183
Map 12.9 - City of Dyersville Existing Land Use 184
Map 12.10 - City of Epworth Existing Land Use 184
Map 12.11 - City of Farley Existing Land Use 185
Map 12.12 - City of Peosta Existing Land Use 185
Map 12.13 - Dubuque County Future Land Use 186
Map 12.14 - City of Asbury Future Land Use 186
Map 12.15 - City of Cascade Future Land Use 187
Map 12.16 - City of Dubuque Future Land Use 187
Map 12.17 - City of Dyersville Future Land Use 188
Map 12.18 - City of Epworth Future Land Use 188
Map 12.19 - City of Farley Future Land Use 189
Map 12.20 - City of Peosta Future Land Use 189
Map 13.1 - Extraterritorial Subdivision Review Boundaries 193